For the last week(ish) iv started to notice that when i get up in the mornings and open my laptops lid that the computer has been on (awake) all night.
I have been keeping an eye on it and it sometimes sleeps properly on lid close but other times when i close the lid the system remains on, the screen remains lit (kinda) and my Bluetooth headphones keep disconnecting and reconnecting for as long as i leave it.
On opening the lid it is all still running, although some things are down and have to be reconnected like the network manager and plasma.
I have tested kernal 57 & 58
some log (not sure if its what would be needed to diagnose)
|31/08/2020 15:52|systemd-sleep|Failed to suspend system. System resumed again: Device or resource busy|
|—|—|—|
|31/08/2020 15:52|kernel|PM: suspend exit|
|31/08/2020 15:52|systemd|systemd-suspend.service: Main process exited, code=exited, status=1/FAILURE|
|31/08/2020 15:52|systemd|systemd-suspend.service: Failed with result ‘exit-code’.|
|31/08/2020 15:52|systemd|Failed to start Suspend.|
|31/08/2020 15:52|systemd|Dependency failed for Suspend.|
|31/08/2020 15:52|audit|SERVICE_START pid=1 uid=0 auid=4294967295 ses=4294967295 msg=‘unit=systemd-suspend comm=“systemd” exe=“/usr/lib/systemd/systemd” hostname=? addr=? terminal=? res=failed’|
|31/08/2020 15:52|systemd|suspend.target: Job suspend.target/start failed with result ‘dependency’.|
|31/08/2020 15:52|systemd|Stopped target Sleep.|
|31/08/2020 15:52|systemd-logind|Operation ‘sleep’ finished.|
|31/08/2020 15:52|kernel|audit: type=1130 audit(1598885558.819:203): pid=1 uid=0 auid=4294967295 ses=4294967295 msg=‘unit=systemd-suspend comm=“systemd” exe=“/usr/lib/systemd/systemd” hostname=? addr=? terminal=? res=failed’|
|31/08/2020 15:52|kded5|bluedevil: About to resume|
|31/08/2020 15:52|ModemManager| [sleep-monitor] system is resuming|
|31/08/2020 15:52|NetworkManager| [1598885558.8260] manager: sleep: wake requested (sleeping: yes enabled: yes)|
|31/08/2020 15:52|NetworkManager| [1598885558.8261] device (enp2s0): state change: unmanaged → unavailable (reason ‘managed’, sys-iface-state: ‘managed’)|
|31/08/2020 15:52|kernel|RTL8208 Fast Ethernet r8169-200:00: attached PHY driver [RTL8208 Fast Ethernet] (mii_bus:phy_addr=r8169-200:00, irq=IGNORE)|
|31/08/2020 15:52|kernel|r8169 0000:02:00.0 enp2s0: Link is Down|
Some software or hardware addition prevents the system from going to sleep. This used to happen with Spotify if Bluetooth headphones were used, but that was corrected a while ago.
So the only advice I can give is:
Remove any hardware you recently added (Wireless mouse? headphones?)
close all software packages one by one and see if that resolves the issue. If you’ve found the culprit: file a bug!
I have not recently added any hardware. I can try to eliminate software although its a very intermittent fault and not something i can keep checking and checking as it takes a little while to sleep/wake so it’s going to be a long and drawn out process Im not even sure how i might close some things like how would i “close” the bluetooth, wifi or the audio on my system, i dont know they have just always been there.
EDIT:- ok i do see a switch on the GUI for the wifi and bluetooth to turn them on/off. I assume that will be enough to test them.
I was hoping there might be a way to use journalctl with a specified filter that would help point to what is causing the suspend to get “stuck”?
So there was nothing in mind regarding this comment? i mean the system is quite aware there is something that is “hanging” and forcing sleep to resume again, is there no way to get the logs to tell us what that is exactly?
Ok, This bug is way too intermittent to debug by a process of elimination. It was 3 days before i did it again and then it did it several times in a row & now its not doing it again.
I did get a slim chance to try turning a couple of things off. I found that when i switched off firefox (which was on youtube with a video window open (but not playing)) It seemed to allow it to sleep again, although it may just have been a coincidence.
More interesting i have found several urls of importance, the main one is here https://01.org/blogs/rzhang/2015/best-practice-debug-linux-suspend/hibernate-issues
I have been trying to follow but its going to take another few weeks of learning as its mostly way over my head.
Anyhow, i have currently set my kernel back to 54 (the last LTS), it will take a week or so to see if its going to help or not.
I am likely to have many questions about the site i linked above though.
Where do i put these “arguments” ?
e.g. Adding the initcall_debug boot option to the kernel cmdline will trace initcalls and the driver pm callbacks during boot, suspend, and resume
Where do look for their output? (will it be in the journalctl somewhere?).
This [HowTo] I wrote shows you how to change kernel parameters:
(and it’s a good to have that activated anyway). The bit where the kernel parameter gets changed is:
echo kernel.sysrq=1 | sudo tee --append /etc/sysctl.d/99-sysctl.conf
where the kernel parameter being changed is kernel.sysrq=1 so just substitute yours for that one (I don’t know, but it’ll probably be initcall_debug=1, check the article)
Its all just to much. I wanted help to make things a little easier not twice as much techno babble as before. Appreciate the help though.
Iv read i can just use /etc/default/grub and add arguments to GRUB_CMDLINE_LINUX_DEFAULT then do a update-grub
Regarding the argument itself, it was just an example. The link i gave list many many for debugging this problem but this is just the first one. It does not say to use an “=1” anywhere?
Quote:-
2.1 initcall_debug
Adding the initcall_debug boot option to the kernel cmdline will trace initcalls and the driver pm callbacks during boot, suspend, and resume. It is useful to check if any specified driver/component fails. Make sure to always enable it when debugging STI/STR/HTD related issues. In general, positive results mean the callback has no error/warning and returns 0 in a reasonable time. This is demonstrated in the following:
[ 76.201970] calling 0000:00:02.0+ @ 2298, parent: pci0000:00
[ 76.217006] call 0000:00:02.0+ returned 0 after 14677 usec
Negative results means the callback either contains some error/warning, or it takes an unreasonable long time to complete.
After adding it (or any of the others) you still didnt say where i should look for their output?
Suspend issues are difficult in any OS. (including Windows)
Yup, you can do that too. I just thought the command would make your life easier.
The following are a few good starting points:
man dmesg
man journatctl
Sorry for making you read even more, but I can’t give you a silver bullet to make this work on your system with your hardware with all of your applications as I don’t have access to your system… (It would take me some thorough investigation too…)
Yea sorry, i didn’t mean to sound harsh its just im banging my head against a wall of “i don’t understand” for the last week and im still nowhere really.
I did manage to get a relevant app to work (i think its working, not 100%sure). This is my system doing a sleep/wake cycle. I just need to try and run it while its failing which is no easy thing and then try and understand what its telling me, its pretty though. https://i.imgur.com/prz6xgP.png
So can i just use /etc/sysctl.d/99-sysctl.conf ? Mine is empty atm so can i just append a load of switches/arguments (whatever they are called).
So if i just make it like this is it ok?
initcall_debug
no_console_suspend
ignore_loglevel
and then save it I don’t need to do an update-grub just reboot (i assume) and all these 3 arguments will be active? How will i test that they are actually active and ready to capture my next sleep failure as that could be days away and i dont want to miss it?
Heres the info on these 3 arguments:-
2.1 initcall_debug
Adding the initcall_debug boot option to the kernel cmdline will trace initcalls and the driver pm callbacks during boot, suspend, and resume. It is useful to check if any specified driver/component fails. Make sure to always enable it when debugging STI/STR/HTD related issues. In general, positive results mean the callback has no error/warning and returns 0 in a reasonable time. This is demonstrated in the following:
[ 76.201970] calling 0000:00:02.0+ @ 2298, parent: pci0000:00 [ 76.217006] call 0000:00:02.0+ returned 0 after 14677 usec
Negative results means the callback either contains some error/warning, or it takes an unreasonable long time to complete.
2.2 no_console_suspend
Adding the no_console_suspend boot option to the kernel cmdline disables suspending of consoles during suspend/hibernate. Once this option is added, debugging messages can reach various consoles while the rest of the system is being put to sleep. This may not work reliably with all consoles, but is known to work with serial and VGA consoles.
2.3 ignore_loglevel
Adding the ignore_loglevel boot option to the kernel cmdline prints all kernel messages to the console no matter what the current loglevel is, which is useful for debugging.
look at the different messages you’re getting during boot:
journalctl --system --boot=-1 | head --lines=25
journalctl --system --boot=0 | head --lines=25
The first command will give you the first 25 lines of the previous boot whereas the second command of the current boot. You should see the parameters applied.
As I said earlier:
P.S. I think you should read this to have a laugh or 2:
Yea but its not just a case of sending it to sleep, i can do that all day long. Iv even got a bash script to sleep/wake on constant rotation on/off/on/off… no. Its a case of catching it when it decides that on a random particular sleep it’s going to fail and stay awake. It only does it on occasion, I can not force it i just have to wait for it to happen.
Yep very funny & interesting. I wish i had the time, iv been away from windows for 2.5 years now. I know quite a lot but my memory is not what it used to be and if i don’t use something for a good while i WILL forget it. I try to keep organized cherrytree notes of every problem iv had and how i fixed it in the end but its never enough.
iv tried initcall_debug=1 (even though i have searched just about everywhere and nowhere do i see an “=1” in any examples or description) but lets try it anyhow.
I’m not familiar with these specific kernel parameters, but in my experience you need to turn on debugging options while compiling the kernel and that’s not a road you want to go down.
(I only ever did this once because I was still on Ubuntu and they’re not as good as Manjaro in providing newer kernels so I kind of had to if I wanted to use the AC portion of my WiFi as I bought a new router)
Release candidate 2 for the 5.9 kernel has been released, so you could try that, but that’s beta software and for something that’s happening every couple of weeks I wouldn’t go down that road…
I’m re-iterating what I said before:
If it happens, look at which piece of software that you run only intermittently is causing this (Keeping a game open would qualify)
rtcwake is a tool that can be used to enter a system sleep state (suspend/hibernate) until a specified wakeup time. And you can easily use it to perform suspend/hibernate stress tests. For example, you can use this simple script to run 1000 STR cycles easily
for i in $(seq 1000); do
    rtcwake –m mem –s 30
done
But when i create a shell script and run it it refuses to see the -s argument and throws an error:-
❰greg❙~/git/pm-graph(git≠master)❱✔≻ sudo ./rtcwake.sh
rtcwake: must provide wake time (see --seconds, --time and --date options)
rtcwake: must provide wake time (see --seconds, --time and --date options)
rtcwake: must provide wake time (see --seconds, --time and --date options)
❰greg❙~/git/pm-graph(git≠master)❱✘≻ cat rtcwake.sh
#!/bin/bash
for i in $(seq 3); do
    rtcwake –m mem –s 30
done
❰greg❙~/git/pm-graph(git≠master)❱✔≻
but I can run sudo rtcwake –m mem –s 30 just fine in the terminal?
 Im not even sure how i might close some things like how would i “close” the bluetooth, wifi or the audio on my system, i dont know they have just always been there.
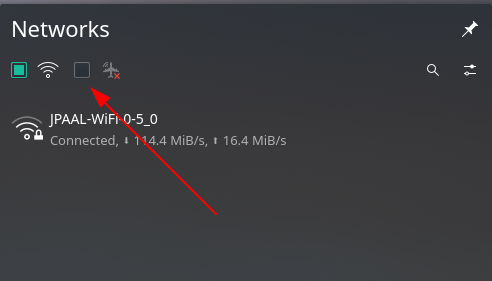
 software that you run only intermittently is causing this (Keeping a game open would qualify)