System hangs and abnormal RAM usage by simple apps

Recently, the system hangs continuously due to insane and unclear high usage of RAM memory. My case appears to be much more worrying than the case shown in the following post: Is it just me, or is Manjaro XFCE using more RAM lately?

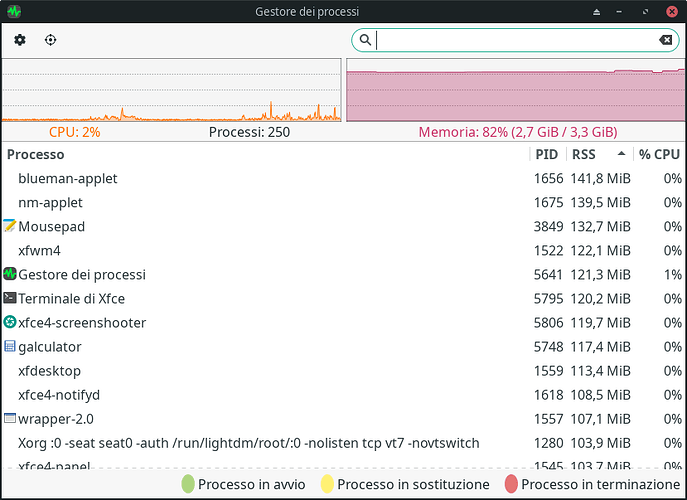
Here us Just an example of ram usage in my desktop running just mousepad, galculator, XFCE terminal and (of course, to get screen) screenshoter (no web browsers or other applications open), for comparing:

How you can see, blueman/nm-applet, galculator and terminal eat more than twice the usual amount of ram these apps eat in a working manjaro system. I don’t know why some simple apps (I’ve just leaved them open, I’ve not worked with those ones) double their usual ram usage (also notifyd seems doubling its normal ram usage).

Immediately after I click on a web browser as firefox, ram usage increase further and, every time ram usage percent touches 97%, after a little bit the system hangs. So, recently, system started to be mostly unusable.

There is another thread reporting this worrying behaviour (High RAM usage suddenly) and in my case I’ve to do a forced hardware reset.

Additionally, here is how ram info appear, now (while I’m typing):

ps aux | awk '{print $2, $4, $11}' | sort -k2rn | head -n 20 && free -h
2165 10.4 /usr/lib/firefox/firefox
3899 6.3 /usr/lib/firefox/firefox
2430 5.2 /usr/lib/firefox/firefox
1792 4.0 /usr/bin/python
1817 3.8 nm-applet
4126 3.6 /usr/bin/xfce4-terminal
1695 3.2 xfdesktop
2302 3.2 /usr/lib/firefox/firefox
1657 3.1 xfwm4
1688 3.0 Thunar
1694 3.0 /usr/lib/xfce4/panel/wrapper-2.0
1680 2.9 xfce4-panel
1701 2.8 /usr/lib/xfce4/panel/wrapper-2.0
2057 2.8 xfce4-taskmanager
1696 2.7 /usr/lib/xfce4/panel/wrapper-2.0
1774 2.7 xfce4-notes
1800 2.7 pamac-tray
1700 2.6 /usr/lib/xfce4/panel/wrapper-2.0
2140 2.0 /usr/bin/viewnior
2249 2.0 /usr/lib/firefox/firefox
               total        used        free      shared  buff/cache   available
Mem:           3,3Gi       2,9Gi       267Mi        18Mi       302Mi       338Mi
Swap:             0B          0B          0B

Very high memory usage appears not depending on kernel version (that was 6.6 but I’m currently running 6.11-rc4) and at first I’ve also upgraded system through official package manager but this big issue has never gone away.

I’d appreciate to know what it’s really happening.

Thanks in advance.
Hi @cristian_c,

Please provide the output of:

inxi -Farz

And

swapon --show
inxi -Farz
System:
  Kernel: 6.11.0-rc4-7-MANJARO arch: x86_64 bits: 64 compiler: gcc v: 14.2.1
    clocksource: hpet avail: acpi_pm
    parameters: BOOT_IMAGE=/boot/vmlinuz-6.11-x86_64
    root=UUID=8259574f-d640-4590-9813-d645eb29dc3f rw quiet apparmor=1
    security=apparmor udev.log_priority=3
  Desktop: Xfce v: 4.18.1 tk: Gtk v: 3.24.43 wm: xfwm4 v: 4.18.0
    with: xfce4-panel tools: light-locker vt: 7 dm: LightDM v: 1.32.0
    Distro: Manjaro base: Arch Linux
Machine:
  Type: Desktop Mobo: Micro-Star model: B350M PRO-VDH (MS-7A38) v: 2.0
    serial: <superuser required> uuid: <superuser required>
    UEFI: American Megatrends v: A.H0 date: 02/02/2019
CPU:
  Info: model: AMD Ryzen 3 2200G with Radeon Vega Graphics bits: 64 type: MCP
    arch: Zen level: v3 note: check built: 2017-19 process: GF 14nm
    family: 0x17 (23) model-id: 0x11 (17) stepping: 0 microcode: 0x810100B
  Topology: cpus: 1x dies: 1 clusters: 1 cores: 4 smt: <unsupported> cache:
    L1: 384 KiB desc: d-4x32 KiB; i-4x64 KiB L2: 2 MiB desc: 4x512 KiB L3: 4 MiB
    desc: 1x4 MiB
  Speed (MHz): avg: 1600 min/max: 1600/3500 boost: enabled scaling:
    driver: acpi-cpufreq governor: schedutil cores: 1: 1600 2: 1600 3: 1600
    4: 1600 bogomips: 28010
  Flags: avx avx2 ht lm nx pae sse sse2 sse3 sse4_1 sse4_2 sse4a ssse3 svm
  Vulnerabilities:
  Type: gather_data_sampling status: Not affected
  Type: itlb_multihit status: Not affected
  Type: l1tf status: Not affected
  Type: mds status: Not affected
  Type: meltdown status: Not affected
  Type: mmio_stale_data status: Not affected
  Type: reg_file_data_sampling status: Not affected
  Type: retbleed mitigation: untrained return thunk; SMT disabled
  Type: spec_rstack_overflow mitigation: SMT disabled
  Type: spec_store_bypass mitigation: Speculative Store Bypass disabled via
    prctl
  Type: spectre_v1 mitigation: usercopy/swapgs barriers and __user pointer
    sanitization
  Type: spectre_v2 mitigation: Retpolines; IBPB: conditional; STIBP:
    disabled; RSB filling; PBRSB-eIBRS: Not affected; BHI: Not affected
  Type: srbds status: Not affected
  Type: tsx_async_abort status: Not affected
Graphics:
  Device-1: Advanced Micro Devices [AMD/ATI] Raven Ridge [Radeon Vega Series
    / Radeon Mobile Series] vendor: Micro-Star MSI driver: amdgpu v: kernel
    arch: GCN-5 code: Vega process: GF 14nm built: 2017-20 pcie: gen: 3
    speed: 8 GT/s lanes: 16 ports: active: DP-1
    empty: DVI-D-1,HDMI-A-1,HDMI-A-2 bus-ID: 38:00.0 chip-ID: 1002:15dd
    class-ID: 0300 temp: 42.0 C
  Display: x11 server: X.Org v: 21.1.13 compositor: xfwm4 v: 4.18.0 driver:
    X: loaded: amdgpu unloaded: modesetting alternate: fbdev,vesa dri: radeonsi
    gpu: amdgpu display-ID: :0.0 screens: 1
  Screen-1: 0 s-res: 1440x900 s-dpi: 96 s-size: 381x238mm (15.00x9.37")
    s-diag: 449mm (17.69")
  Monitor-1: DP-1 mapped: DisplayPort-0 model: HannSpree/HannStar Hanns.G
    HB171 serial: <filter> built: 2008 res: 1440x900 hz: 60 dpi: 90 gamma: 1.2
    size: 408x255mm (16.06x10.04") diag: 436mm (17.2") ratio: 16:10, 15:9
    modes: max: 1440x900 min: 720x400
  API: OpenGL Message: Unable to show GL data. glxinfo is missing.
Audio:
  Device-1: Advanced Micro Devices [AMD/ATI] Raven/Raven2/Fenghuang HDMI/DP
    Audio driver: snd_hda_intel v: kernel pcie: gen: 3 speed: 8 GT/s lanes: 16
    bus-ID: 38:00.1 chip-ID: 1002:15de class-ID: 0403
  Device-2: Advanced Micro Devices [AMD] Family 17h/19h HD Audio
    vendor: Micro-Star MSI driver: snd_hda_intel v: kernel pcie: gen: 3
    speed: 8 GT/s lanes: 16 bus-ID: 38:00.6 chip-ID: 1022:15e3 class-ID: 0403
  API: ALSA v: k6.11.0-rc4-7-MANJARO status: kernel-api with: aoss
    type: oss-emulator tools: alsactl,alsamixer,amixer
  Server-1: JACK v: 1.9.22 status: off tools: N/A
  Server-2: PipeWire v: 1.2.3 status: off tools: pw-cli
  Server-3: PulseAudio v: 17.0 status: active with: pulseaudio-alsa
    type: plugin tools: pacat,pactl,pavucontrol
Network:
  Device-1: Realtek RTL8111/8168/8211/8411 PCI Express Gigabit Ethernet
    vendor: Micro-Star MSI driver: r8169 v: kernel pcie: gen: 1 speed: 2.5 GT/s
    lanes: 1 port: f000 bus-ID: 1b:00.0 chip-ID: 10ec:8168 class-ID: 0200
  IF: enp27s0 state: down mac: <filter>
  Device-2: Qualcomm Atheros AR928X Wireless Network Adapter vendor: Lite-On
    driver: ath9k v: kernel pcie: gen: 1 speed: 2.5 GT/s lanes: 1
    bus-ID: 1d:00.0 chip-ID: 168c:002a class-ID: 0280
  IF: wlp29s0 state: up mac: <filter>
  Info: services: NetworkManager, smbd, systemd-networkd,
    systemd-timesyncd, wpa_supplicant
Bluetooth:
  Device-1: Cambridge Silicon Radio Bluetooth Dongle (HCI mode) driver: btusb
    v: 0.8 type: USB rev: 2.0 speed: 12 Mb/s lanes: 1 mode: 1.1 bus-ID: 1-9:5
    chip-ID: 0a12:0001 class-ID: fe01
  Report: btmgmt ID: hci0 rfk-id: 2 state: up address: <filter> bt-v: 2.0
    lmp-v: 3 status: discoverable: yes pairing: yes class-ID: 6c0104
Drives:
  Local Storage: total: 2.98 TiB used: 205.39 GiB (6.7%)
  SMART Message: Required tool smartctl not installed. Check --recommends
  ID-1: /dev/nvme0n1 maj-min: 259:0 vendor: Samsung
    model: MZALQ256HBJD-00BL2 size: 238.47 GiB block-size: physical: 512 B
    logical: 512 B speed: 31.6 Gb/s lanes: 4 tech: SSD serial: <filter>
    fw-rev: 5L2QFXM7 temp: 39.9 C scheme: GPT
  ID-2: /dev/sda maj-min: 8:0 vendor: Toshiba model: HDWD130 size: 2.73 TiB
    block-size: physical: 4096 B logical: 512 B speed: 6.0 Gb/s tech: HDD
    rpm: 7200 serial: <filter> fw-rev: ACF0 scheme: GPT
  ID-3: /dev/sdb maj-min: 8:16 vendor: Generic model: SD MMC size: 14.84 GiB
    block-size: physical: 512 B logical: 512 B type: USB rev: 2.0 spd: 480 Mb/s
    lanes: 1 mode: 2.0 tech: SSD serial: <filter> fw-rev: 1.00 scheme: MBR
  ID-4: /dev/sdf maj-min: 8:80 vendor: SMI (STMicroelectronics)
    model: USB DISK size: 7.54 GiB block-size: physical: 512 B logical: 512 B
    type: USB rev: 2.1 spd: 480 Mb/s lanes: 1 mode: 2.0 tech: N/A
    serial: <filter> fw-rev: 1100 scheme: GPT
Partition:
  ID-1: / raw-size: 238.17 GiB size: 233.38 GiB (97.99%)
    used: 205.39 GiB (88.0%) fs: ext4 dev: /dev/nvme0n1p2 maj-min: 259:2
  ID-2: /boot/efi raw-size: 300 MiB size: 299.4 MiB (99.80%)
    used: 300 KiB (0.1%) fs: vfat dev: /dev/nvme0n1p1 maj-min: 259:1
Swap:
  Alert: No swap data was found.
Sensors:
  System Temperatures: cpu: 42.0 C mobo: N/A gpu: amdgpu temp: 42.0 C
  Fan Speeds (rpm): N/A
Repos:
  Packages: 1600 pm: dpkg pkgs: 0 pm: pacman pkgs: 1568 libs: 446 tools: pamac
    pm: flatpak pkgs: 23 pm: snap pkgs: 9
  Active pacman repo servers in: /etc/pacman.d/mirrorlist
    1: http://ftp.snt.utwente.nl/pub/linux/manjaro/stable/$repo/$arch
    2: http://mirror1.sox.rs/manjaro/stable/$repo/$arch
    3: http://manjaro.mirrors.uk2.net/stable/$repo/$arch
    4: http://cofractal-ewr.mm.fcix.net/manjaro/stable/$repo/$arch
    5: http://opencolo.mm.fcix.net/manjaro/stable/$repo/$arch
    6: http://mirrors.xtom.jp/manjaro/stable/$repo/$arch
    7: http://kartolo.sby.datautama.net.id/manjaro/stable/$repo/$arch
    8: http://mirror.2degrees.nz/manjaro/stable/$repo/$arch
Info:
  Memory: total: 4 GiB note: est. available: 3.28 GiB used: 3.07 GiB (93.6%)
  Processes: 315 Power: uptime: 1h 36m states: freeze,mem,disk suspend: deep
    avail: s2idle wakeups: 1 hibernate: platform avail: shutdown, reboot,
    suspend, test_resume image: 1.3 GiB services: upowerd,xfce4-power-manager
    Init: systemd v: 256 default: graphical tool: systemctl
  Compilers: clang: 18.1.8 gcc: 14.2.1 Shell: Bash v: 5.2.32
    running-in: xfce4-terminal inxi: 3.3.36

swapon --show returns nothing except the prompt. As you can see, memory usage has raised 93%:

  Memory: total: 4 GiB note: est. available: 3.28 GiB used: 3.07 GiB (93.6%)

Still, I don’t understand the origin of this abnormal memory usage.

As I thought, you don’t have any SWAP space configured:

You also have very little RAM:

4 GB used to be a lot, it’s not anymore.

I suggest setting up some SWAP space and see if it’s better. If it’s not, then report back for more help.

https://wiki.archlinux.org/title/Swap

2 Likes

Sorry but I don’t understand: I’ve also linked a few threads where it’s clear this xfce behaviour is not dependent on amount of ram installed. I could run manjaro xfce until some weeks ago without noticing this very high usage and I’ve also connected other installations to this machine comparing task managers: many processes on the other installations eat less than half of memory compared to this installation (RSS column) and in this running system processes keep growing without reason, as I’ve noticed today. If I install new ram bank and I enable swap, I can avoid system hangs for now but I don’t solve this issue which can get worse over time.

I can’t tell you anything else or anything more than I’ve done. The fact that, according to you and those links, this is an Xfce-specific problem, just show that

  1. There’s not really anything Manjaro can do 'bout it; and
  2. it’s not something related to you only.

Why you didn’t have problems before, well: :man_shrugging: especially with that little RAM and no SWAP space.

I’ve even got SWAP and I have 16GB RAM.

No swap means it’s not surprising the system hangs. Firefox on its own often needs over 4G during moderate use! For me, 8G is not really enough; I do have an appropriately-sized swap partition.

1 Like

@Mirdarthos, @BG405, I mean, I don’t think I should suddenly need 8 GB ram to run just a calculator and a terminal. Just these apps and nothing else (so no web browsing neither) have took the RAM usage to 82% (I still believe it’s not normal). I agree that additional RAM is needed for more heavy loads but, as already reported, this is a system failure (probably, as you’ve said, it could be related to xfce itself and not manjaro but it could be the opposite too - who knows?). As I’ve said, also consider that this issue doesn’t happen on a different - and UPDATED (kernel version updated too - v6.10) - manjaro installation (connected to the same machine). So, I can’t get the point, unless you mean a temporary solution to avoid hangs for now - which doesn’t solve or find the reason for this abnormal ram usage.

First, as Mirdarthos said, with only 3.3GB of ram swap is an absolute must.

However, something clearly isn’t right, the same processes on my xfce with 24GB ram use:

  • nm-applet 57MB
  • mousepad 56MB
  • xfdesktop 52MB
  • xfwm4 89MB
  • xfce4-notifyd 39MB

It might be very obvious but have you tried to shut the machine completely down (not just “reboot”) and then starting it up again? Another issue might be your 6.11.0-rc4 kernel; as long as you’re troubleshooting just switch to the 6.6LTS.

And as an add-on, yes, I use Manjaro xfce on <4GB ram and never had any issues as long as things are kept lean and sensible (few panel-items (avoid electron), max 3-5 browser tabs, etc).

If you happen to use containerised apps (.flatpak for example), these can potentially add to memory usage/requirement, especially as some remain in memory after closing them. Just a thought, for what it’s worth.

On the topic of swap – with only ~4 GB of RAM, you absolutely should be utilising either a swap partition (or file if you don’t use hibernation).

Whatever the absolute cause of your high memory usage, adequate swap space will alleviate it to the extent it can.

Here are some links that might be useful:

Cheers.

@6x12, thanks for your reply, the values you’ve shown are absolutely consistent with the values I can find in a normal installation. Of course, I already tried to boot manjaro starting from a pc completely powered off. When this trouble happened, I was already running kernel version 6.6 and upgrading to v6.11 has changed nothing. So, I can state with confidence that this crazy behavior is not dependent on kernel version.

@soundofthunder,

If you happen to use containerised apps (.flatpak for example), these can potentially add to memory usage/requirement, especially as some remain in memory after closing them. Just a thought, for what it’s worth.

BTW, I wonder how it is possible since RAM memory is volatile (Volatile memory - Wikipedia) and is cleared after shutdown/reboot. Are you saying apps could make their data persist into RAM across different system sessions?

I agree swap could be needed/useful for heavier tasks. BTW, this useless and unknown memory utilisation by simple apps could undermine memory increase when running a task/load making use of a considerable amount of memory.

I can confirm what you said
and what @6x12 said

roughly double the usual amount

But:
noone, just like you, has got any idea
why your RAM usage apparently doubled

Perhaps you could try and use/boot another kernel instead of 6.11.0-rc4-7-MANJARO

Is your system up to date?
This Kernel very likely isn’t the best, although it appears to be the most recent.

No one else has got this issue - the chances of you finding out the reason is pretty low.

so:

if change kernel = success --> good
if change kernel = no change --> back up and reinstall

would be my recommendation

No, but while the session is active, any resident data can be suspended to RAM or included with data saved to disk (hibernation).

Still, this is fruitless without knowing if it’s applicable to you.
Do you use any containerised apps?

Previous posts were about Xfce using more RAM after boot than before, that is not incorrect but does not mean anything when the system is in use

The amount of used RAM in use after boot can be reduced by disabling Autostart applications
xfce4-session:preferences [Xfce Docs]
But this would not resolve issues with applications in use after boot

4.14. with high RAM usage compared to 4.12? / General discussion / Xfce Forums

discussion of memory usage is moot once you open a web browser.

Screenshot in OP shows 250 processes, but I would expect about 220-225 processes running after boot

For latest Manjaro (24.0.8) minimal ISO with Task Manager, Thunar, Mousepad and xfce4-terminal :

[manjaro@manjaro ~]$ free -h; inxi -mIa
               total        used        free      shared  buff/cache   available
Mem:            15Gi       1.2Gi        13Gi       389Mi       1.5Gi        14Gi
Swap:             0B          0B          0B
Memory:
  System RAM: total: 16 GiB available: 15.6 GiB used: 1.28 GiB (8.2%)
  Message: For most reliable report, use superuser + dmidecode.
  Array-1: capacity: 16 GiB slots: 2 modules: 2 EC: None
    max-module-size: 8 GiB note: est.
  Device-1: DIMM0 type: N/A size: 8 GiB speed: 1600 MT/s volts: N/A
    width (bits): data: 64 total: 64 manufacturer: N/A part-no: N/A serial: N/A
  Device-2: DIMM1 type: N/A size: 8 GiB speed: 1600 MT/s volts: N/A
    width (bits): data: 64 total: 64 manufacturer: N/A part-no: N/A serial: N/A
Info:
  Processes: 223 Power: uptime: 5m states: freeze,standby,mem,disk
    suspend: deep avail: s2idle,shallow wakeups: 0 hibernate: platform
    avail: shutdown, reboot, suspend, test_resume image: 6.2 GiB
    services: upowerd,xfce4-power-manager Init: systemd v: 256
    default: graphical tool: systemctl
  Packages: pm: pacman pkgs: 1049 libs: 301 tools: pamac Compilers: N/A
    Shell: Bash v: 5.2.32 running-in: xfce4-terminal inxi: 3.3.36

I suggest boot a Live ISO and check RAM usage and number of processes

Use sudo dmidecode to get information about processes to compare to installed OS

Also suggest clear any saved sessions
xfce4-session:preferences - Session [Xfce Docs]

1 Like

Just as an FYI… I had this same issue and adding SWAP made all the difference!

1 Like

I’m not sure that the OP wants to acknowledge that lack of swap might be contributing.

2 Likes

For the OP (and anyone else interested) here’s a quite decent article on the matter of swap space.

In particular:

Operating systems like Windows or Linux provide a certain amount of swap space by default, which users can later change in accordance with their requirements. Users can also disable swap space, but that means that the kernel must kill some processes to create enough free RAM for new processes.

“Bolded” part by me. Same applies if no swap defined in the first place; I’m seeing that a lot lately.

Linux also reserves a portion of your RAM by default for caching purposes, etc. .

It could be considered more than doubled (also, this issue seems slowly getting worse) and this is not an apparent ram usage but real usage (I mean that RAM is really taken from these apps even if they do nothing). As I’ve already said, I normally experience this issue with kernel v6.6 and only afterwards I’ve upgraded to v6.11 but nothing has changed. I’m not exactly the only user experiencing this issue but my case is just a bit more severe than cases reported by other users (I linked a few threads about that).

I don’t know this aspect very much but I think that apps eating an abnormal amount of memory are not containerised. If we assume what you’re saying is correct, it could not be applied to my case, since I’ve powered the machine on many times from a completely shutdown state.

Your suggestion would be reasonable if this issue was regarding just autostarted apps but anyway it doesn’t explain why those processes suddenly have more than doubled their ram usage.

Even if your total system ram is four times the size than mine, the same processes are eating a smaller amount of memory in your system compared to me, which means my installation appears to be broken for some reason (it was not in the past). BTW, this is the result of the command when I run that on my system:

free -h; inxi -mIa
               total        used        free      shared  buff/cache   available
Mem:           3,3Gi       3,0Gi       202Mi        19Mi       360Mi       328Mi
Swap:             0B          0B          0B
Memory:
  System RAM: total: 4 GiB available: 3.28 GiB used: 2.99 GiB (91.1%)
  Message: For most reliable report, use superuser + dmidecode.
  Array-1: capacity: 256 GiB note: check slots: 4 modules: 1 EC: None
    max-module-size: 64 GiB note: est.
  Device-1: Channel-A DIMM 0 type: no module installed
  Device-2: Channel-A DIMM 1 type: DDR4 detail: synchronous unbuffered
    (unregistered) size: 4 GiB speed: spec: 2400 MT/s actual: 1200 MT/s volts:
    note: check curr: 1 min: 1 max: 1 width (bits): data: 64 total: 64
    manufacturer: Samsung part-no: M378A5244CB0-CRC serial: 89F31F75
  Device-3: Channel-B DIMM 0 type: no module installed
  Device-4: Channel-B DIMM 1 type: no module installed
Info:
  Processes: 255 Power: uptime: 51m states: freeze,mem,disk suspend: deep
    avail: s2idle wakeups: 0 hibernate: platform avail: shutdown, reboot,
    suspend, test_resume image: 1.27 GiB services: upowerd,xfce4-power-manager
    Init: systemd v: 256 default: graphical tool: systemctl
  Packages: 1600 pm: dpkg pkgs: 0 pm: pacman pkgs: 1568 libs: 446
    tools: pamac pm: flatpak pkgs: 23 pm: snap pkgs: 9 Compilers: clang: 18.1.8
    gcc: 14.2.1 Shell: Bash v: 5.2.32 running-in: xfce4-terminal inxi: 3.3.36

I’m not sure that running Live ISO could represent a useful test because live session is loaded itself into ram by live media (dvd, usb, iso, etc…), so I can’t evaluate well this aspect compared to an installed system. I’ve launched Session and Startup (as shown by xfce documentation) but there is not a Saved Sessions tab there, in my case.

Swap is very useful/needed for all the loads where it’s required a greater amount of memory (and I’ve got benefit from that in past). In this case, instead, a large amount of memory is wasted for no reason (and origin of this behavior is unknown until now).

Swap is useful in more cases than the example you gave. If it were me, I’d start there… configure a swap partition (8 GB if you wish to hibernate, or 4GB if you don’t) or a swap file if you have sufficient space on / (root).

And then, I would re-evaluate the abnormal RAM usage. At the moment you have no configured swap at all, which probably will not enhance your situation. This abnormally high RAM simply has nowhere to go.

Also check that you have plenty of unused space on / (root) – in fact, on all partitions you may have. A rule-of-thumb is to make sure 20%-25% unused space remains on each partition.

I’ll say it again: RAM usage is likely to be an issue if the OS has no space to put “less-needed” stuff to free up RAM needed for current processes. If there’s nowhere to offload stuff, what is it supposed to do with that data?

… Of course, it has to dump it, which, depending on the involved processes, may cause an apparent system-wide stall, hang, crash etc. .

The way Linux tends to work is it pre-allocates RAM; it doesn’t just leave available resources sitting there idle.