Used memory is what free reports.
The bar memory counter in htop is not the same.
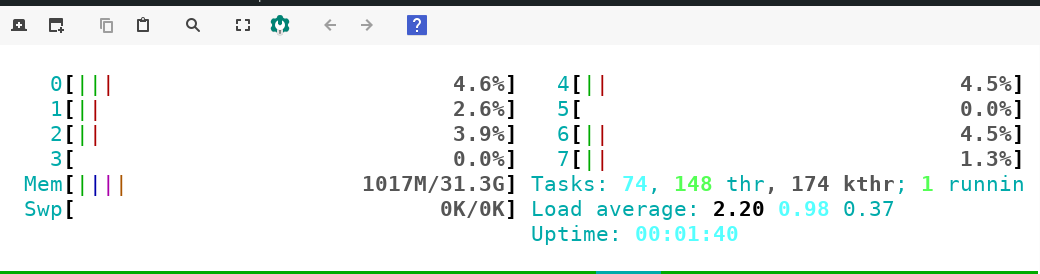
Add a detailed text memory counter in htop now, and come again.
Waiting for your results.

Used memory is what free reports.
The bar memory counter in htop is not the same.
Add a detailed text memory counter in htop now, and come again.
Waiting for your results.
@omano Yes, that appears to be the case. Before this, I assumed that the memory reported in htop is the same as the one in free. But I was clearly mistaken. I am still rather curious about the difference though, even though that knowledge might not have any practical value other than to save beginners some unnecessary confusion about RAM usage.
@nikgnomic A good way to start is to just find out how htop and task manager define “ram usage.”
After all the comments above, essentially, the gist of this post becomes: “Why does htop’s numbers differ from those of free?”
It helps to understand the meaning behind the numbers htop reports.
And one quick google answered that question.
According to this answer on AskUbuntu:
Main difference is
htopcounts cached memory and buffers into free memory, whereasfreecommand does not.
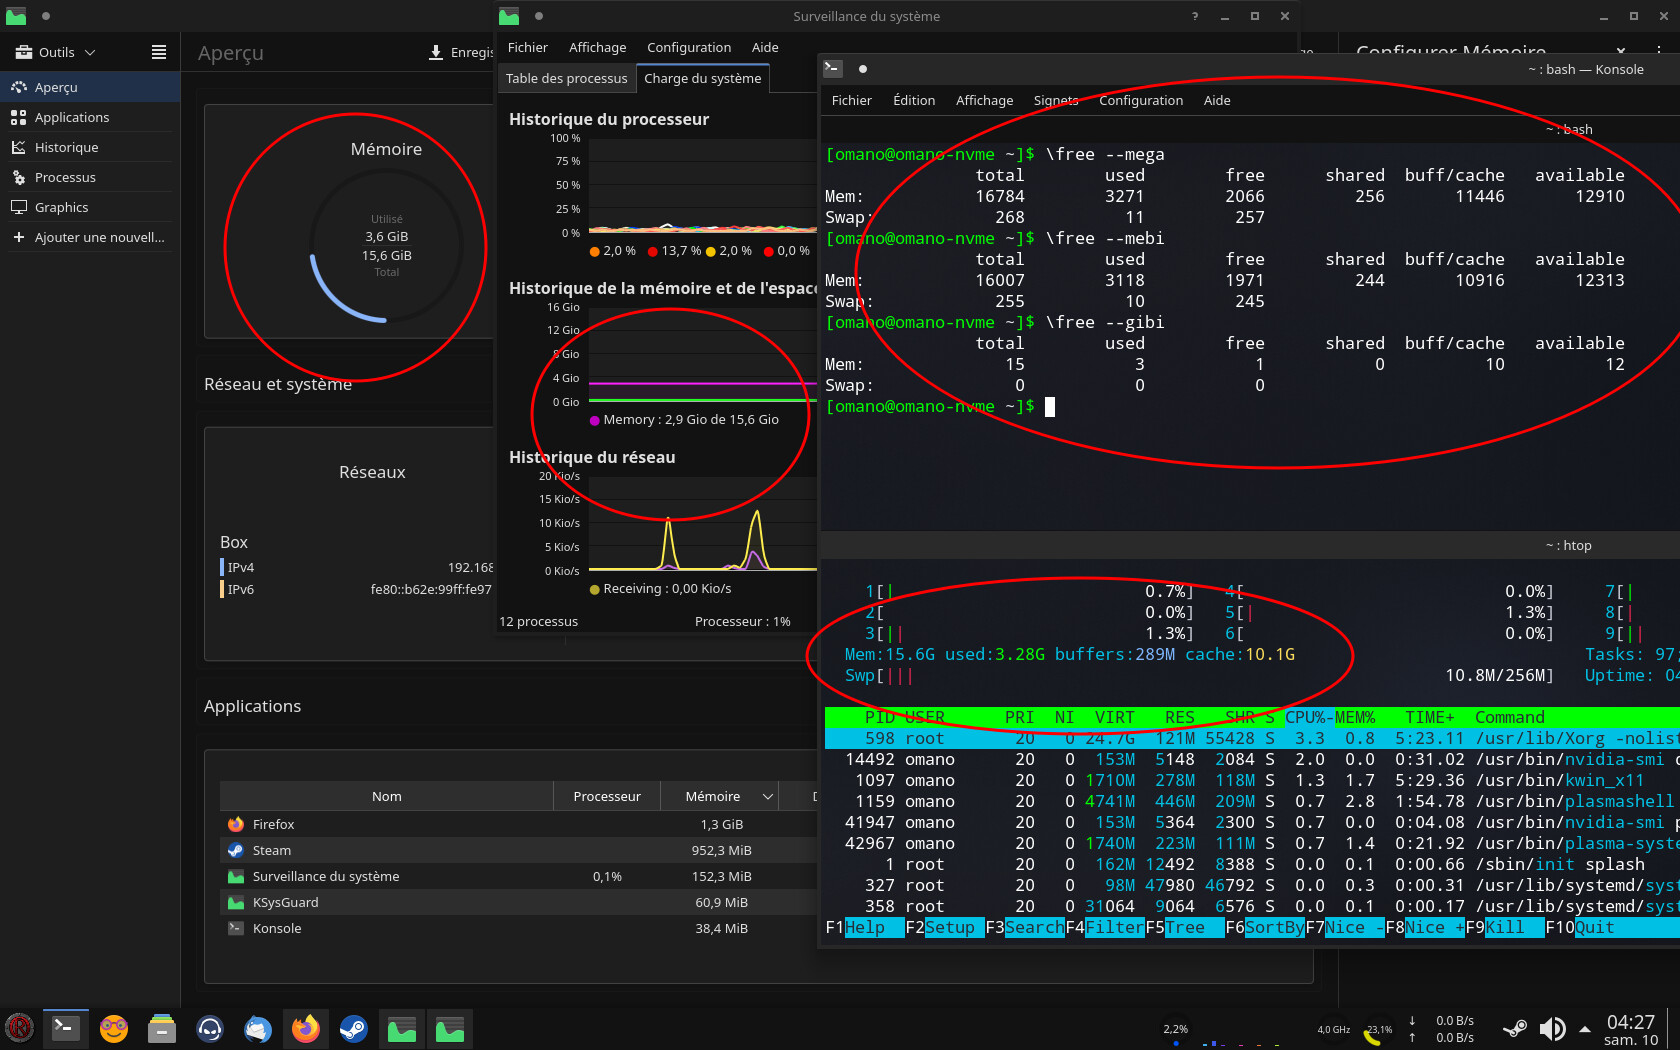
If you want more to think about, explain me this now lol (this is why I posted my previous reply, the following image is from another thread where I found out this):
Different tools, different results, most of them not making sense (especially the KDE tools, my conclusion was that they are garbage, and opening tickets on KDE seems to be useless, based on my short experience where they ‘fixed’ another bug I reported regarding the hard drive space used, but it didn’t fix anything, and they got silenced when I tried to have this looked at again so I don’t bother I count on people more motivated than me to get things fixed).
free seems to be reliable, other tools are approximative.
And for a more detailed answer about the difference between htop and free, read this:
https://unix.stackexchange.com/questions/65835/htop-reporting-much-higher-memory-usage-than-free-or-top
Some interesting reading ahead, thanks, I’ll be looking into this… first I’d heard of ‘free’. As a beginner, speaking anecdotally, I started habitually loading HTOP immediately after any reboot for about a year now. I run humongous Firefox sessions and had to keep an eye on resources lest my system freeze up before properly saving a session. No longer much of a problem now that I’ve jumped from 8 to 16, now 32GB of ram.
Anyway, that htop “mem” figure was what I was keeping an eye on. Lets say at least 40 reboots over a year, whatever it actually means mem has always been around 600 at boot. After the last update, immediately after booting and loading htop, it went to 1000+. Just rebooted for the sake of science ![]()
[tgz@xfce-1 ~]$ inxi -Fza
System:
  Kernel: 5.10.68-1-MANJARO x86_64 bits: 64 compiler: gcc v: 11.1.0
  parameters: BOOT_IMAGE=/boot/vmlinuz-5.10-x86_64
  root=UUID=cf9d3d26-6bb5-40df-bf67-b4729a325742 rw quiet apparmor=1
  security=apparmor udev.log_priority=3
  Desktop: Xfce 4.16.0 tk: Gtk 3.24.29 info: xfce4-panel wm: xfwm 4.16.1
  vt: 7 dm: LightDM 1.30.0 Distro: Manjaro Linux base: Arch Linux
Machine:
  Type: Portable System: Dell product: Precision M6500 v: N/A
  serial: <filter> Chassis: type: 8 serial: <filter>
  Mobo: Dell model: 0R1203 serial: <filter> BIOS: Dell v: A10
  date: 06/04/2013
Battery:
  ID-1: BAT0 charge: 88.0 Wh (100.0%) condition: 88.0/93.2 Wh (94.4%)
  volts: 12.3 min: 11.1 model: Samsung SDI DELL 3M19008 type: Li-ion
  serial: <filter> status: Full
CPU:
  Info: Quad Core model: Intel Core i7 Q 740 bits: 64 type: MT MCP
  arch: Nehalem family: 6 model-id: 1E (30) stepping: 5 microcode: A cache:
  L2: 6 MiB
  flags: lm nx pae sse sse2 sse3 sse4_1 sse4_2 ssse3 vmx bogomips: 27672
  Speed: 931 MHz min/max: 933/1734 MHz boost: enabled Core speeds (MHz):
  1: 931 2: 931 3: 931 4: 931 5: 931 6: 931 7: 931 8: 931
  Vulnerabilities: Type: itlb_multihit status: KVM: VMX disabled
  Type: l1tf
  mitigation: PTE Inversion; VMX: conditional cache flushes, SMT vulnerable
  Type: mds status: Vulnerable: Clear CPU buffers attempted, no microcode;
  SMT vulnerable
  Type: meltdown mitigation: PTI
  Type: spec_store_bypass
  mitigation: Speculative Store Bypass disabled via prctl and seccomp
  Type: spectre_v1
  mitigation: usercopy/swapgs barriers and __user pointer sanitization
  Type: spectre_v2 mitigation: Full generic retpoline, IBPB: conditional,
  IBRS_FW, STIBP: conditional, RSB filling
  Type: srbds status: Not affected
  Type: tsx_async_abort status: Not affected
Graphics:
  Device-1: AMD Broadway XT [Mobility Radeon HD 5870]
  vendor: Dell FirePro M7820 driver: radeon v: kernel bus-ID: 01:00.0
  chip-ID: 1002:68a0 class-ID: 0300
  Device-2: Logic3 / SpectraVideo plc G-720 Keyboard type: USB
  driver: hid-generic,usbhid bus-ID: 2-1.4.1.1.4.4:24 chip-ID: 1267:0103
  class-ID: 0300
  Display: x11 server: X.Org 1.20.13 compositor: xfwm4 v: 4.16.1 driver:
  loaded: ati,radeon unloaded: modesetting alternate: fbdev,vesa
  display-ID: :0.0 screens: 1
  Screen-1: 0 s-res: 1920x1200 s-dpi: 96 s-size: 508x317mm (20.0x12.5")
  s-diag: 599mm (23.6")
  Monitor-1: LVDS res: 1920x1200 hz: 60
  Monitor-2: DisplayPort-0 res: 1920x1200 hz: 60 dpi: 94
  size: 519x324mm (20.4x12.8") diag: 612mm (24.1")
  OpenGL: renderer: AMD JUNIPER (DRM 2.50.0 / 5.10.68-1-MANJARO LLVM 12.0.1)
  v: 3.3 Mesa 21.2.2 compat-v: 3.1 direct render: Yes
Audio:
  Device-1: Intel 5 Series/3400 Series High Definition Audio vendor: Dell
  driver: snd_hda_intel v: kernel bus-ID: 00:1b.0 chip-ID: 8086:3b56
  class-ID: 0403
  Device-2: AMD Juniper HDMI Audio [Radeon HD 5700 Series] vendor: Dell
  driver: snd_hda_intel v: kernel bus-ID: 01:00.1 chip-ID: 1002:aa58
  class-ID: 0403
  Sound Server-1: ALSA v: k5.10.68-1-MANJARO running: yes
  Sound Server-2: JACK v: 1.9.19 running: no
  Sound Server-3: PulseAudio v: 15.0 running: yes
  Sound Server-4: PipeWire v: 0.3.37 running: no
Network:
  Device-1: Broadcom NetXtreme BCM5761e Gigabit Ethernet PCIe vendor: Dell
  driver: tg3 v: kernel port: de00 bus-ID: 09:00.0 chip-ID: 14e4:1680
  class-ID: 0200
  IF: eno1 state: up speed: 1000 Mbps duplex: full mac: <filter>
RAID:
  Hardware-1: Intel 82801 Mobile SATA Controller [RAID mode] driver: ahci
  v: 3.0 port: 6ea0 bus-ID: 00:1f.2 chip-ID: 8086.282a rev: 05
  class-ID: 0104
Drives:
  Local Storage: total: 447.14 GiB used: 32.84 GiB (7.3%)
  SMART Message: Required tool smartctl not installed. Check --recommends
  ID-1: /dev/sda maj-min: 8:0 vendor: Intel model: SSDSA2CW160G3
  size: 149.05 GiB block-size: physical: 512 B logical: 512 B
  speed: 3.0 Gb/s type: SSD serial: <filter> rev: 0362 scheme: MBR
  ID-2: /dev/sdb maj-min: 8:16 type: USB model: Mass Storage Device
  size: 298.09 GiB block-size: physical: 512 B logical: 512 B type: N/A
  serial: <filter> scheme: MBR
Partition:
  ID-1: / raw-size: 149.05 GiB size: 145.71 GiB (97.76%)
  used: 32.84 GiB (22.5%) fs: ext4 dev: /dev/sda1 maj-min: 8:1
Swap:
  Alert: No swap data was found.
Sensors:
  System Temperatures: cpu: 50.0 C mobo: N/A sodimm: SODIMM C gpu: radeon
  temp: 53.0 C
  Fan Speeds (RPM): cpu: 2619
Info:
  Processes: 251 Uptime: 3m wakeups: 1 Memory: 31.28 GiB
  used: 1.01 GiB (3.2%) Init: systemd v: 249 tool: systemctl Compilers:
  gcc: 11.1.0 Packages: pacman: 1302 lib: 398 flatpak: 0 Shell: Bash
  v: 5.1.8 running-in: xfce4-terminal inxi: 3.3.06
It was one of the first post, but just in case, good information are there. Good to read it to understand more how it works.
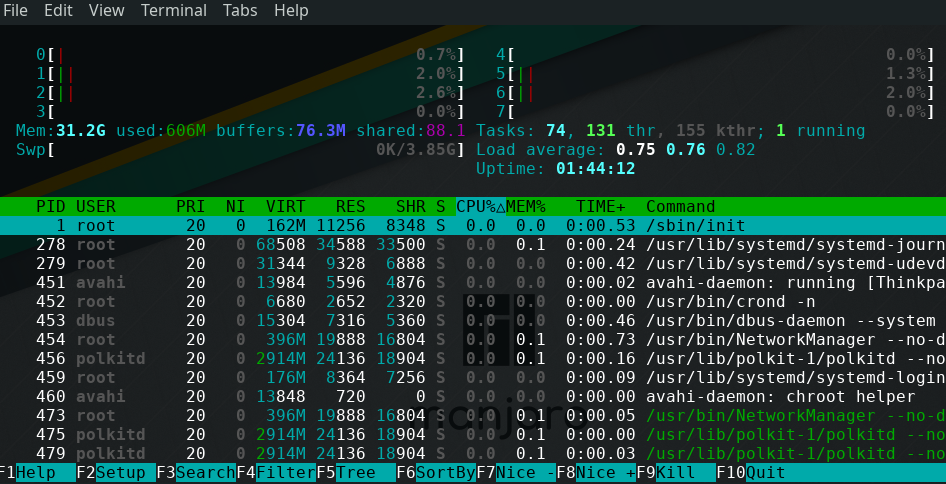
Maybe some updated programs make the system cache more things than before, but still look at the real memory used, with free, or htop with the other RAM meter (not the bar one, but the detailed text one
The USED part is what you’re looking for.
I think it is a good practice to keep track of the amount of resources the system is using. Just to keep track of things, you know?
If you want to learn more about free, I do recommend checking out the article I just posted.
Seconded. I like this answer. And in case anyone is wondering how to change the bar style to numbers style: just go to options in htop, select meters, switch to the memory meter and hit space to change the style of the display.
thanks to all! great info here, much appreciated, glad I posted
Manjaro forum search found this answer:
And a detailed explanation here
Why are htop and system monitor showing different memory usages - #11 by omano
