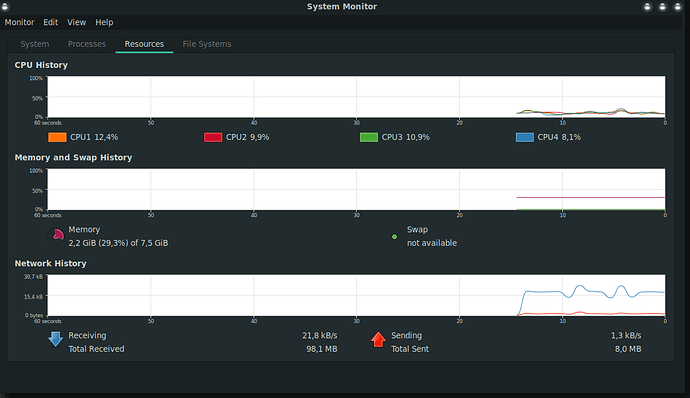
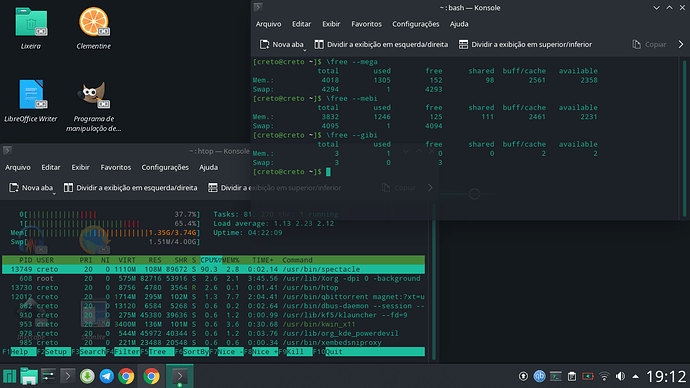
Hey guys I have been using manjaro for quite a bit and today I noticed that htop was showing that nearly 900mb of memory is being used whereas system monitor showed that nearly 450mb of memory is being used. I know there should be probably a reason for this. Can anyone of you guys explain me this out?
What are you calling “system monitor”?
OP means KSysGuard. 
… which is KSysGuard. 
on kde plasma yes
but on mate is system monitor
… and OP is running KDE acc. to their profile.
Yes, yes, basically the user @viveksray17 was referring to the System Monitor (ksysguard) which doesn’t matter the given name is the same and the htop (command line)
What I really agree is that, also yes, the memory test results really do differ between the two.
But ksysguard and system monitor are the same person he he he he
T+ = See you later
It’s probably a bug, I had one fixed for the disk space 436300 – More disk usage reported in Plasma System Monitor then what other tools report after I made some verification for a thread where what seemed a little difference was actually huge discrepancy…
Maybe the other one (memory for instance) also has issue.
//EDIT: no OK it is KSysGuard not Plasma System Monitor (why I asked first lol many tools are called system monitor, and didn’t remember KSysGuard was what we were talking about it is not the same as System Monitor, the Plasma app replacing/improving KSysGuard). Anyway, both apps use similar tools I think and Plasma System Monitor also have a difference in memory usage. Still worth a proper report for both tools.
//EDIT2: I think the issue I had fixed is not even properly fixed  If I mount drives, or unmount drives, and restart the app it doesn’t even change the disk usage… Great…
KSysguard shows applications memory consumption only by default,it don’t show the buffered + cache values that htop has (i think),you can change it if you edit the shreet in ~/.local/share/ksysguard/ and search for
sensorName="mem/physical/application"/>
change application to used for example,save and restart KSysguard.
No top does that, htop only shows the really used memory (not cache, not buffer), it even has a color code to represent the buffer (blue) and cache (yellow) next to the really used memory (green). You can change the display option with SPACEBAR when you go to htop settings->meters.
But now that I think about it, the difference here is the UNIT used.
MB =/= MiB
MB = Mega Byte
MiB = Mebi Byte
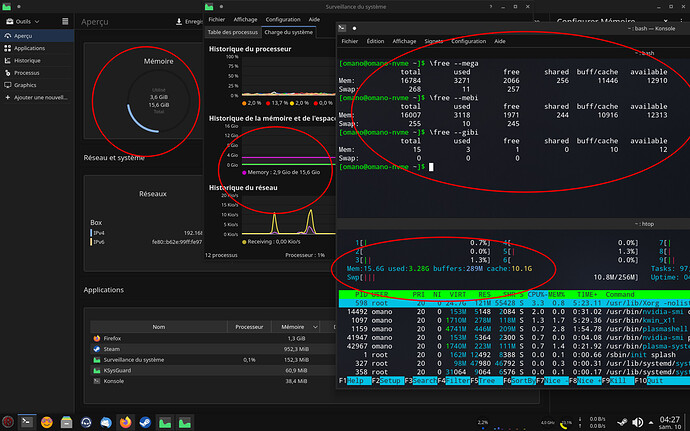
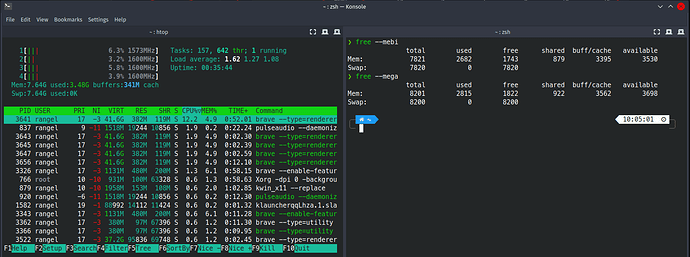
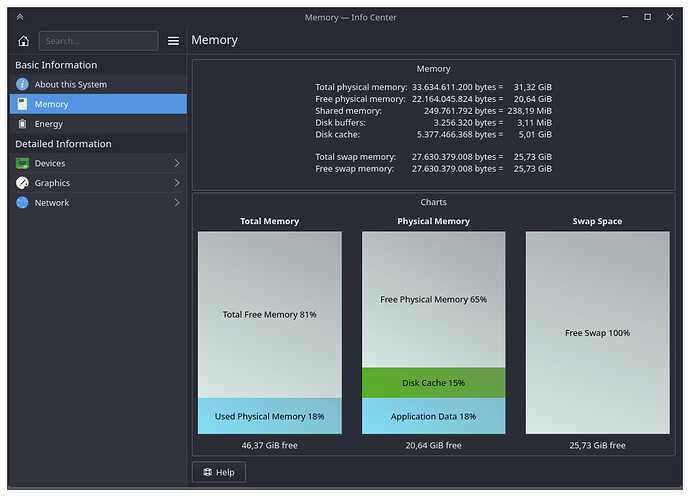
But even with that, numbers don’t match between KSysGuard, Plasma System Monitor, htop, and free.
You can see both KDE tools show different results from the two other tools. the free and htop tools have similar results, if we assume htop is using MEGA Bytes.
I think both KDE tools are garbage regarding how they count memory, this is very not clear.
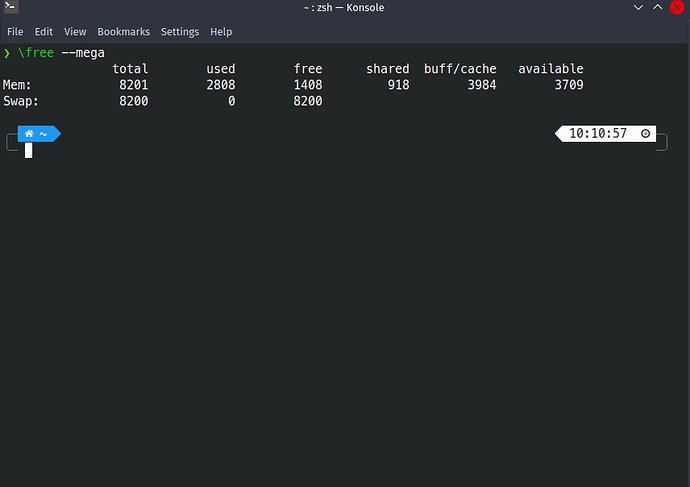
Are you sure your free command is no an alias? Put a backslash before your command to be sure for a test.
It doesn’t use the alias if one is set.
PS: I will let it settle and let others do the work for now. For me htop is accurate, and seem to have same output as free. The other tools show incorrect values. I can’t figure it out. Have fun people 
//EDIT: no actually none of them tools have same output.
Got it Thx.
Edit : on Ubuntu both were showing the same. Does ubuntu have any different config?
while running 2 VMs,4 GB each;
ksysguard shows that around 2GB are in use while Htop shows what it should be,around 10GB.
You look at the Memory Info in KDE.
It shows 3 different usages of the memory (buffers + cache + shared). You should calculate all 3 together.
You can compare it with htop, /free --mebi and system-monitor .
I checked them, but htop and system-monitor are not correct for me.
Edit:
Maybe system-monitor calculates all usages of memories from CPU and GPU?
htop, /free --mebi and system-monitor ignore the disk cache, so it is not calculated.
