System using high cpu when i start the computer

,

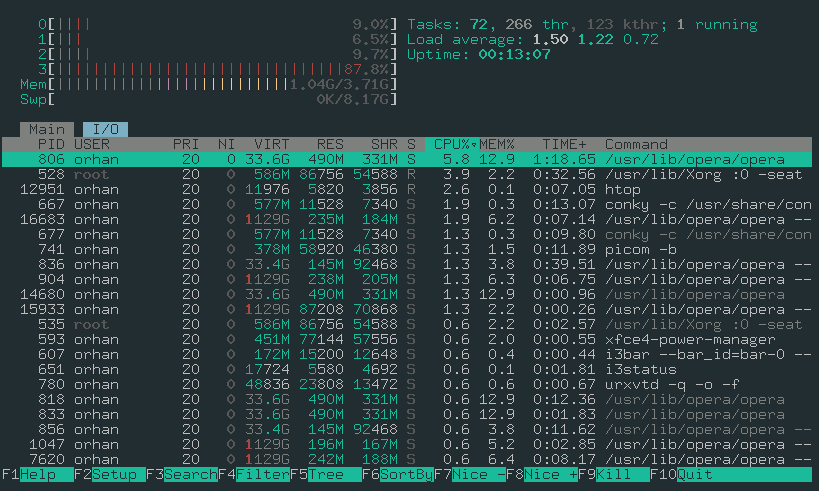
Hello everyone. I am newbie in manjaro. I like manjaro but i have a big problem. My problem is cpu using high frequency at cpu3 ( like cpu0, cpu1, cpu2 ). Firstly i shutdown computer, and open later, my cpu3 have %87 load (minimum) in htop. my cpu fan work harder. Others is normal ( cpu0,1,2).
if i restart my computer, it works fine. For example, I finished my works and shutdown machine. When i starting computer, cpu3 have %87 load again. and i restart it, all is well.
Why does my system work different. I could not solve this problem.

This is a laptop and i have i3 3210U (two core) 1.8 Ghz with HD4000 Graphics. I have 4 GiB Ram and I use manjaro i3 WM community edition. My kernel is 5.15. sorry i don’t know some codes about manjaro. i am still learning.

i will be wait your helps.
Good day.

Hello @orhanpolat and welcome :wink:

Well you can open htop. Is there nothing that is working on one core? Possibly it is a service like updatedb.service for mlocate.

baloo enabled ? i guess and this terrible service freaks out any system. i recommend to disable this service first and check if it solves the problem. furthermore we need some basic information so please post the output of

inxi --admin --verbosity=7 --filter --no-host --width 

use the option of preformatted text and insert the output there.

How can i look for which program effected to one core? I look at htop for mlocate services. There is no service. it looks normal in htop except %87 using cpu.

@Olli

System:
  Kernel: 5.15.78-1-MANJARO arch: x86_64 bits: 64 compiler: gcc v: 12.2.0
    parameters: BOOT_IMAGE=/@/boot/vmlinuz-5.15-x86_64
    root=UUID=9a7773d5-a0c0-40dd-8ffb-558d727c004a rw rootflags=subvol=@ quiet
    apparmor=1 security=apparmor
    resume=UUID=921cf226-6b37-487c-9392-022a773b80e8 udev.log_priority=3
  Desktop: i3 v: 4.21.1 info: i3bar vt: 7 dm: LightDM v: 1.32.0
    Distro: Manjaro Linux base: Arch Linux
Machine:
  Type: Laptop System: Quanta product: JW6H v: 03 serial: <superuser required>
    Chassis: type: 10 v: UK serial: <superuser required>
  Mobo: Quanta model: JW6H v: TBD serial: <superuser required> UEFI: Insyde
    v: GU111 date: 07/05/2013
Battery:
  ID-1: BAT0 charge: 0% condition: 18.9/32.6 Wh (58.2%) volts: 11.3 min: 14.8
    model: SMP-SDI2 MWL31b type: Li-ion serial: N/A status: N/A
Memory:
  RAM: total: 3.71 GiB used: 1.66 GiB (44.8%)
  RAM Report: permissions: Unable to run dmidecode. Root privileges required.
CPU:
  Info: model: Intel Core i3-3217U bits: 64 type: MT MCP arch: Ivy Bridge
    gen: core 3 level: v2 built: 2012-15 process: Intel 22nm family: 6
    model-id: 0x3A (58) stepping: 9 microcode: 0x21
  Topology: cpus: 1x cores: 2 tpc: 2 threads: 4 smt: enabled cache:
    L1: 128 KiB desc: d-2x32 KiB; i-2x32 KiB L2: 512 KiB desc: 2x256 KiB
    L3: 3 MiB desc: 1x3 MiB
  Speed (MHz): avg: 1796 min/max: 800/1800 scaling: driver: intel_cpufreq
    governor: schedutil cores: 1: 1796 2: 1796 3: 1796 4: 1796 bogomips: 14374
  Flags: acpi aperfmperf apic arat arch_perfmon avx bts clflush cmov
    constant_tsc cpuid cpuid_fault cx16 cx8 de ds_cpl dtes64 dtherm dts epb
    ept erms est f16c flexpriority flush_l1d fpu fsgsbase fxsr ht ibpb ibrs
    ida lahf_lm lm mca mce md_clear mmx monitor msr mtrr nonstop_tsc nopl nx
    pae pat pbe pcid pclmulqdq pdcm pebs pge pln pni popcnt pse pse36 pti pts
    rdtscp rep_good sep smep ss ssbd sse sse2 sse4_1 sse4_2 ssse3 stibp
    syscall tm tm2 tpr_shadow tsc tsc_deadline_timer vme vmx vnmi vpid x2apic
    xsave xsaveopt xtopology xtpr
  Vulnerabilities:
  Type: itlb_multihit status: KVM: VMX disabled
  Type: l1tf mitigation: PTE Inversion; VMX: conditional cache flushes, SMT
    vulnerable
  Type: mds mitigation: Clear CPU buffers; SMT vulnerable
  Type: meltdown mitigation: PTI
  Type: mmio_stale_data status: Unknown: No mitigations
  Type: retbleed status: Not affected
  Type: spec_store_bypass mitigation: Speculative Store Bypass disabled via
    prctl and seccomp
  Type: spectre_v1 mitigation: usercopy/swapgs barriers and __user pointer
    sanitization
  Type: spectre_v2 mitigation: Retpolines, IBPB: conditional, IBRS_FW,
    STIBP: conditional, RSB filling, PBRSB-eIBRS: Not affected
  Type: srbds status: Not affected
  Type: tsx_async_abort status: Not affected
Graphics:
  Device-1: Intel 3rd Gen Core processor Graphics vendor: QUANTA driver: i915
    v: kernel arch: Gen-7 process: Intel 22nm built: 2012-13 ports: active: VGA-1
    off: LVDS-1 empty: DP-1,HDMI-A-1 bus-ID: 00:02.0 chip-ID: 8086:0166
    class-ID: 0300
  Device-2: Acer USB HD Webcam type: USB driver: uvcvideo bus-ID: 2-1.3:3
    chip-ID: 5986:0523 class-ID: 0e02 serial: <filter>
  Display: x11 server: X.Org v: 21.1.4 compositor: Picom v: git-7e568 driver:
    X: loaded: modesetting alternate: fbdev,vesa dri: crocus gpu: i915
    display-ID: :0 screens: 1
  Screen-1: 0 s-res: 1680x1050 s-dpi: 96 s-size: 443x277mm (17.44x10.91")
    s-diag: 522mm (20.57")
  Monitor-1: LVDS-1 note: disabled model: AU Optronics 0x303c
    serial: <filter> built: 2009 res: N/A dpi: 112 gamma: 1.2
    size: 309x173mm (12.17x6.81") diag: 354mm (13.9") ratio: 16:9
    modes: 1366x768
  Monitor-2: VGA-1 pos: primary model: LG (GoldStar) W2242 serial: <filter>
    built: 2008 res: 1680x1050 hz: 60 dpi: 90 gamma: 1.2
    size: 474x296mm (18.66x11.65") diag: 585mm (23") ratio: 3:2, 16:10 modes:
    max: 1680x1050 min: 720x400
  API: OpenGL Message: Unable to show GL data. Required tool glxinfo missing.
Audio:
  Device-1: Intel 7 Series/C216 Family High Definition Audio vendor: QUANTA
    driver: snd_hda_intel v: kernel bus-ID: 00:1b.0 chip-ID: 8086:1e20
    class-ID: 0403
  Sound API: ALSA v: k5.15.78-1-MANJARO running: yes
  Sound Server-1: JACK v: 1.9.21 running: no
  Sound Server-2: PulseAudio v: 16.1 running: no
  Sound Server-3: PipeWire v: 0.3.59 running: no
Network:
  Device-1: Realtek RTL8188CE 802.11b/g/n WiFi Adapter vendor: AzureWave
    AW-NE139H Half-size Mini PCIe Card driver: rtl8192ce v: kernel pcie: gen: 1
    speed: 2.5 GT/s lanes: 1 port: 4000 bus-ID: 07:00.0 chip-ID: 10ec:8176
    class-ID: 0280
  IF: wlp7s0 state: up mac: <filter>
  IP v4: <filter> type: dynamic noprefixroute scope: global
    broadcast: <filter>
  IP v6: <filter> type: noprefixroute scope: link
  Device-2: Qualcomm Atheros AR8161 Gigabit Ethernet vendor: QUANTA
    driver: alx v: kernel pcie: gen: 1 speed: 2.5 GT/s lanes: 1 port: 3000
    bus-ID: 08:00.0 chip-ID: 1969:1091 class-ID: 0200
  IF: enp8s0 state: down mac: <filter>
  WAN IP: <filter>
Bluetooth:
  Message: No bluetooth data found.
Logical:
  Message: No logical block device data found.
RAID:
  Message: No RAID data found.
Drives:
  Local Storage: total: 111.79 GiB used: 16.48 GiB (14.7%)
  SMART Message: Required tool smartctl not installed. Check --recommends
  ID-1: /dev/sda maj-min: 8:0 vendor: Silicon Power
    model: SPCC Solid State Disk size: 111.79 GiB block-size: physical: 512 B
    logical: 512 B speed: 6.0 Gb/s type: SSD serial: <filter> rev: 02.6
    scheme: GPT
  Message: No optical or floppy data found.
Partition:
  ID-1: / raw-size: 103.33 GiB size: 103.33 GiB (100.00%)
    used: 16.48 GiB (15.9%) fs: btrfs dev: /dev/sda2 maj-min: 8:2 label: N/A
    uuid: 9a7773d5-a0c0-40dd-8ffb-558d727c004a
  ID-2: /boot/efi raw-size: 300 MiB size: 299.4 MiB (99.80%)
    used: 608 KiB (0.2%) fs: vfat dev: /dev/sda1 maj-min: 8:1 label: NO_LABEL
    uuid: 1D5C-7332
  ID-3: /home raw-size: 103.33 GiB size: 103.33 GiB (100.00%)
    used: 16.48 GiB (15.9%) fs: btrfs dev: /dev/sda2 maj-min: 8:2 label: N/A
    uuid: 9a7773d5-a0c0-40dd-8ffb-558d727c004a
  ID-4: /var/cache raw-size: 103.33 GiB size: 103.33 GiB (100.00%)
    used: 16.48 GiB (15.9%) fs: btrfs dev: /dev/sda2 maj-min: 8:2 label: N/A
    uuid: 9a7773d5-a0c0-40dd-8ffb-558d727c004a
  ID-5: /var/log raw-size: 103.33 GiB size: 103.33 GiB (100.00%)
    used: 16.48 GiB (15.9%) fs: btrfs dev: /dev/sda2 maj-min: 8:2 label: N/A
    uuid: 9a7773d5-a0c0-40dd-8ffb-558d727c004a
Swap:
  Kernel: swappiness: 60 (default) cache-pressure: 100 (default)
  ID-1: swap-1 type: partition size: 8.17 GiB used: 0 KiB (0.0%) priority: -2
    dev: /dev/sda3 maj-min: 8:3 label: swap
    uuid: 921cf226-6b37-487c-9392-022a773b80e8
Unmounted:
  Message: No unmounted partitions found.
USB:
  Hub-1: 1-0:1 info: Full speed or root hub ports: 2 rev: 2.0 speed: 480 Mb/s
    chip-ID: 1d6b:0002 class-ID: 0900
  Hub-2: 1-1:2 info: Intel Integrated Rate Matching Hub ports: 6 rev: 2.0
    speed: 480 Mb/s chip-ID: 8087:0024 class-ID: 0900
  Device-1: 1-1.2:3 info: Logitech Unifying Receiver type: Keyboard,Mouse
    driver: logitech-djreceiver,usbhid interfaces: 2 rev: 2.0 speed: 12 Mb/s
    power: 98mA chip-ID: 046d:c534 class-ID: 0301
  Device-2: 1-1.4:4 info: Logitech Classic Keyboard 200 type: Keyboard
    driver: hid-generic,usbhid interfaces: 1 rev: 1.1 speed: 1.5 Mb/s
    power: 100mA chip-ID: 046d:c315 class-ID: 0301
  Hub-3: 2-0:1 info: Full speed or root hub ports: 2 rev: 2.0 speed: 480 Mb/s
    chip-ID: 1d6b:0002 class-ID: 0900
  Hub-4: 2-1:2 info: Intel Integrated Rate Matching Hub ports: 6 rev: 2.0
    speed: 480 Mb/s chip-ID: 8087:0024 class-ID: 0900
  Device-1: 2-1.3:3 info: Acer USB HD Webcam type: Video driver: uvcvideo
    interfaces: 2 rev: 2.0 speed: 480 Mb/s power: 500mA chip-ID: 5986:0523
    class-ID: 0e02 serial: <filter>
Sensors:
  System Temperatures: cpu: 55.0 C mobo: N/A
  Fan Speeds (RPM): N/A
Info:
  Processes: 212 Uptime: 15m wakeups: 1 Init: systemd v: 251 default: graphical
  tool: systemctl Compilers: gcc: 12.2.0 clang: 14.0.6 Packages: pm: pacman
  pkgs: 1122 libs: 335 tools: pamac,yay Shell: Bash v: 5.1.16
  running-in: urxvtd inxi: 3.3.23

I don’t see baloo. I checked my installed programs in.

Do you start opera automatically? Otherwise your screenshot of a already running and idle system is useless.

Upon starting, all kinds of services are started which are needed for a running system. There is not much you can do about this.

Which CPU percentage would you find acceptable?

Not automaticly. Opera was started when i take screenshot on htop. if i closed opera it doesn’t change too much. idle sysytem always use about %87 of core3.
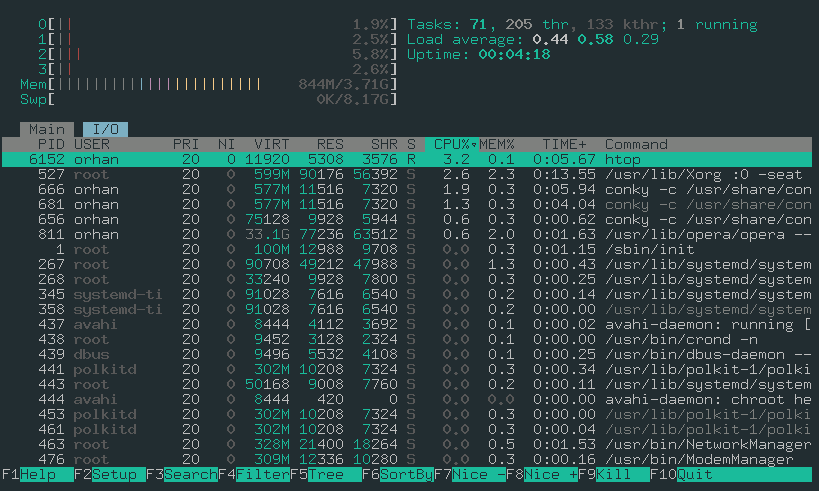
I will share htop screen with you after reboot on my laptop. in screen, there is acceptable load on core3 as much as same programs are open.

I can accept balanced percentage to every core of cpu like picture. Because i feel my laptop’s ability.

use the performance-setting of the cpu-frequency governor. your cpu isn’t very powerful for nowadays needs.
https://wiki.archlinux.org/title/CPU_frequency_scaling

Could you take a screenshot of when this actually happens?

@Olli , i studied a little about CPU frequency scaling, how to do. i tried something with cpupower-gui. I switched frequency up and down. it was looks high frequency all core’s particle at first time. All of them always working on 1.8 Ghz. my machine’s performance was changing with switched frequency. now, i think my problem can be directly connected with scaling drivers. it is not working well when i starting laptop. if i reboot laptop all is working fine. But what is it? How we can know it? i guess i should study much more.

@mithrial it was always happen when i start the computer except reboot. if i start with the reboot, i have no problem with cpu frequency.

The color red means that a kernel thread is responsible for that CPU usage, htop does not show those by default. Press Shift+K to display them. Maybe that will tell us more.

Since htop displays it in red, it have to be a kernel task, a module etc. Probably something in direction of encryption and entropy plus the spectre/meltdown mitigation can procedure higher cpu usage on specific task.

It is not a Linux only problem, but also affect Windows 11 for example when you use a really old cpu as a research showed me.

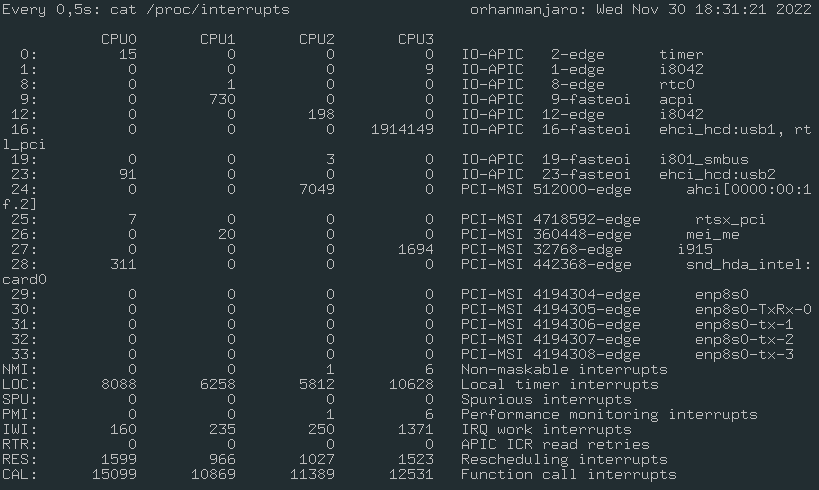
When you encounter this next time then run this:

watch -n0.5 cat /proc/interrupts  

and look for a process that increases very fast. Then you should know what kind of kernel task it is.

Here is a reference:

i tried interrupts code. one of them is increase very fast on cpu3 especially.

in this screenshot, i paste this code below

          CPU0       CPU1       CPU2       CPU3

16:          0          0          0   11753596   IO-APIC  16-fasteoi   ehci_hcd:usb1, rt l_pci

Apparently it’s either related to USB or the realtek wifi adapter. Are there USB devices connected? Does the problem go away if you disconnect them? Or does it go away if you turn off wifi in the settings?

When i turned off wifi, the problem is solved. Thanks to all. :clap: :clap:

So, how can i create a bash that is firstly disconnect wifi and then connect again automaticly when i started computer? So, i can put to i3 config as a start application.

So the problem goes away if you turn the wifi off and then on?

That is a stupid workaround. Check what wifi driver is in use and try switching from hardware encryption to software encryption for example.

inxi -Nazy
modinfo nameofdriver

Temporary:

sudo modprobe -vr nameofdriver
sudo modprobe -v nameofdriver key=value key=value

Permanent:

echo "options nameofdriver key=value key=value" | sudo tee /etc/modprobe.d/wifi.conf