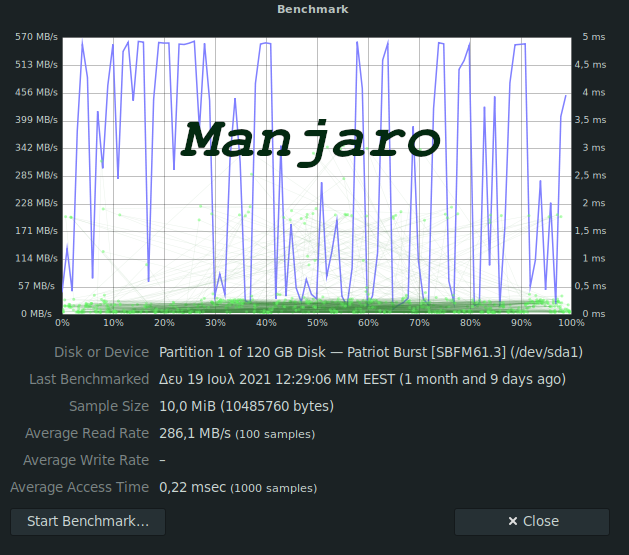
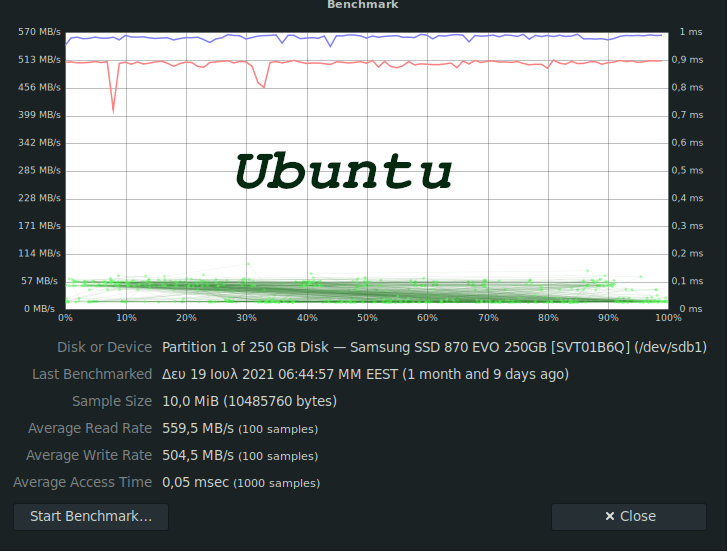
I know my question is not important but I am curious that a disk with an average speed of 286 MB / s is way far faster to boot than one with an average speed of 559 MB / s.
Manjaro-mate vs Ubuntu-mate.
I know that it plays a significant role applications run at startup but i can not figure out how long it takes for ssd samsung to boot so believing it is a hdd!!
Thank you in advance
To debug the slow boot, we need the outputs of systemd-analyze blame and systemd-analyze critical chain.
However, I don’t know why the average read rate in Manjaro is almost half of that in Ubuntu.
[joe@joe-Manjaro ~]$ systemd-analyze blame
7.574s man-db.service
3.240s polkit.service
2.657s cups.service
2.049s udisks2.service
1.755s avahi-daemon.service
1.755s systemd-random-seed.service
1.753s NetworkManager.service
1.538s systemd-logind.service
1.182s dev-sda1.device
1.122s logrotate.service
 976ms geoclue.service
 948ms lightdm.service
 797ms ModemManager.service
 766ms systemd-journal-flush.service
 682ms wpa_supplicant.service
 675ms systemd-fsck@dev-disk-by\x2duuid-826362bc\x2de4dd\x2d4a91\x2da2f8\x2d840>
 631ms add-autologin-group.service
 580ms accounts-daemon.service
 553ms tlp.service
 503ms systemd-udevd.service
 405ms lm_sensors.service
 232ms systemd-tmpfiles-setup-dev.service
 216ms alsa-restore.service
 216ms systemd-modules-load.service
 211ms linux-module-cleanup.service
 158ms systemd-journald.service
 155ms modprobe@drm.service
 154ms systemd-tmpfiles-setup.service
 147ms lvm2-monitor.service
 146ms colord.service
 128ms modprobe@fuse.service
 125ms systemd-udev-trigger.service
 124ms user@1000.service
 124ms systemd-binfmt.service
 116ms dev-hugepages.mount
 116ms dev-mqueue.mount
 115ms sys-kernel-debug.mount
 114ms sys-kernel-tracing.mount
 114ms kmod-static-nodes.service
 112ms modprobe@configfs.service
  76ms systemd-remount-fs.service
  55ms upower.service
  47ms home.mount
  46ms ufw.service
  37ms systemd-tmpfiles-clean.service
  22ms systemd-sysctl.service
  11ms systemd-update-utmp.service
   6ms systemd-user-sessions.service
   6ms user-runtime-dir@1000.service
   5ms rtkit-daemon.service
   4ms tmp.mount
   1ms proc-sys-fs-binfmt_misc.mount
   1ms sys-kernel-config.mount
   1ms sys-fs-fuse-connections.mount


[joe@joe-Manjaro ~]$ systemd-analyze critical-chain
The time when unit became active or started is printed after the "@" character.
The time the unit took to start is printed after the "+" character.

graphical.target @8.991s
└─multi-user.target @8.991s
  └─ModemManager.service @8.193s +797ms
    └─polkit.service @4.951s +3.240s
      └─basic.target @4.811s
        └─sockets.target @4.811s
          └─dbus.socket @4.811s
            └─sysinit.target @4.797s
              └─systemd-update-utmp.service @4.785s +11ms
                └─systemd-tmpfiles-setup.service @4.630s +154ms
                  └─local-fs.target @4.629s
                    └─home.mount @4.582s +47ms
                      └─systemd-fsck@dev-disk-by\x2duuid-826362bc\x2de4dd\x2d4a>
                        └─dev-disk-by\x2duuid-826362bc\x2de4dd\x2d4a91\x2da2f8\>
Manjaro.Wait to boot from ubuntu to send the other!
Ubuntu resolts

joe@joe-desktop:~$ systemd-analyze blame
7.706s fstrim.service
5.347s NetworkManager-wait-online.service
1.738s udisks2.service
 814ms tor@default.service
 758ms man-db.service
 691ms dev-sdb1.device
 631ms logrotate.service
 359ms networkd-dispatcher.service
 337ms snapd.service
 309ms cups.service
 277ms accounts-daemon.service
 199ms polkit.service
 195ms apparmor.service
 175ms lightdm.service
 173ms avahi-daemon.service
 169ms NetworkManager.service
 169ms systemd-modules-load.service
 167ms plymouth-quit-wait.service
 160ms ModemManager.service
 142ms systemd-resolved.service
 134ms systemd-logind.service
 130ms thermald.service
 126ms wpa_supplicant.service
 126ms tlp.service
 122ms apport.service
 114ms systemd-timesyncd.service
 112ms e2scrub_reap.service
 110ms user@1000.service
 108ms upower.service
 102ms keyboard-setup.service
  98ms systemd-udev-trigger.service
  92ms alsa-restore.service
  91ms lm-sensors.service
  90ms systemd-journald.service
  79ms rsyslog.service
  77ms grub-common.service
  77ms gpu-manager.service
  76ms systemd-journal-flush.service
  71ms systemd-udevd.service
  62ms colord.service
  55ms pppd-dns.service
  42ms tor.service
  38ms snapd.seeded.service
  37ms networking.service
  36ms systemd-sysusers.service
  33ms systemd-random-seed.service
  30ms systemd-tmpfiles-setup.service
  29ms systemd-fsck@dev-disk-by\x2duuid-c8bfc0f9\x2d9668\x2d48d9\x2d83f7\x2d680>
  24ms kerneloops.service
  23ms openvpn.service
  21ms systemd-remount-fs.service
  21ms systemd-user-sessions.service
  20ms hddtemp.service
  18ms plymouth-start.service
  18ms systemd-sysctl.service
  18ms dev-hugepages.mount
  18ms dev-mqueue.mount
  17ms sys-kernel-debug.mount
  16ms sys-kernel-tracing.mount
  16ms snapd.apparmor.service
  15ms sys-kernel-config.mount
  14ms grub-initrd-fallback.service
  14ms user-runtime-dir@1000.service
  13ms plymouth-read-write.service
  12ms systemd-update-utmp-runlevel.service
  12ms home.mount
  12ms kmod-static-nodes.service
  12ms systemd-tmpfiles-setup-dev.service
  11ms modprobe@configfs.service
  11ms modprobe@drm.service
  11ms console-setup.service
  11ms modprobe@fuse.service
  10ms systemd-update-utmp.service
  10ms sys-fs-fuse-connections.mount
   8ms setvtrgb.service
   8ms ufw.service
   4ms ifupdown-pre.service
   3ms rtkit-daemon.service
   1ms snapd.socket


joe@joe-desktop:~$ systemd-analyze critical-chain
The time when unit became active or started is printed after the "@" character.
The time the unit took to start is printed after the "+" character.

graphical.target @1min 35.841s
└─multi-user.target @1min 35.841s
  └─kerneloops.service @1min 35.816s +24ms
    └─network-online.target @1min 35.810s
      └─NetworkManager-wait-online.service @1min 30.462s +5.347s
        └─NetworkManager.service @1min 30.289s +169ms
          └─dbus.service @1min 30.287s
            └─dbus.socket @1min 30.280s
              └─basic.target @1min 30.279s
                └─sockets.target @1min 30.279s
                  └─cups.socket @1min 30.612s
                    └─sysinit.target @1min 30.264s
                      └─snapd.apparmor.service @1.137s +16ms
                        └─apparmor.service @940ms +195ms
                          └─local-fs.target @937ms
                            └─run-user-1000-gvfs.mount @1min 36.845s
                              └─run-user-1000.mount @1min 36.649s
                                └─local-fs-pre.target @284ms
                                  └─keyboard-setup.service @182ms +102ms
                                    └─systemd-journald.socket @175ms
                                      └─system.slice @105ms
                                        └─-.slice @105ms
I see fstrim cups and others slowing down.I left ubuntu just in case somthing go too wrong! Must fix alitle things.
I’m guilty ! 
Just for your information, there is currently a hot tech news item regarding a malpractice among several SSD makers.
Long story short, they introduce a new and fast model, and then silently replace the chipset a little farther into production without changing the information and type number of the drive. These new drives are then crippled from a certain used capacity onward, when performance then suddenly radically drops for the remaining storage area of the drive.
Among the guilty ones are Samsung and Western Digital.
For what it’s worth, I’m using Ubuntu MATE and Manjaro KDE on the same NVMe drive. Manjaro (Btrfs) starts much faster than Ubuntu (ext4).
Anybody smell collusion? Wouldn’t be the first time.
Yes… 
The collusion includes