Selecting a mounted NAS on Dolphin causing high network activity

Hmmmmmm…OK. Well, then let’s see if we can find out what is causing the traffic. Install nethogs. It’s in the community repository:

$ pamac search nethogs                                                                                                                                                                                                       
[...]
[Installed] 0.8.7-1                 community
A net top tool which displays traffic used per process instead of per IP or interface

So install it with:

pamac install nethogs

It has to be run in a terminal emulator with sudo. So open your terminal, and run it:

sudo nethogs

It should show you the processes using the network, and from that we should be able to deduce the reason for the traffic.

To exit nethogs, press q while it has focus.

Can you use ‘top’ command to see which process is working hard in that moment?

I already have nethogs. It just shows traffic coming from my NAS to my node (computer)

(Sorry, have to be a screen shot as i can’t copy from it)

1 Like

Nothing is using anything (processor wise) not really.

Last minute load average in 1.84…?

OK, according to me, this :point_down:

Isn’t a lot, anyway. However, compared to mine : :point_down:

it is. So my next question, how do you access the NAS? Perhaps it would be better to have a systemd sutomount unit for it:

Other than that, :man_shrugging:

Im not going back over the “how to mount NAS” debacle again, it gave me a 4 day headache last time i tried ^^
Im pretty sure its the way Dolphin tries to “look” at every file and how it deals with my nas, especially my zfs one which has every file duplicated 100’s if not 1000’s times due to the snapshot’ing that zfs is designed for.

I just need a way to tell dolphin to not try and calculate the file sizes on specific mount paths like /mnt for example.

@Arrababiski

well i suppose Dolphin is showing at the top on here, but hardly using a lot.

1 Like

Sorry, im not sure what you mean. I mount it with fstab and access it via dolphin and ssh and ftp and smb etc

cat /etc/fstab | grep TRUE
//192.168.2.102/main /mnt/nas/TRUENAS cifs user,nofail,credentials=/home/greg/.smbcredentials-nas,iocharset=utf8,uid=1000,gid=1000,noperm,_netdev 0 0

OK, so that looks like SAMBA. You could unmount it and see if that fixes it? That way, you’d at least confirm whether it is, indeed, the NAS.

Another option is to turn on per-folder details view in Dolphin, and hiding that column. Maybe that will work, maybe not. But there is only one way to find out.

O right, sorry misunderstood you. Yes this mount that i am referring to on Dolphin is a SMB mount.

Which it would because it is only when i point Dolphin to look at that particular mount that it does it, so if i unmount it there would be nothing to look at. All other folders work fine.
Other SMB NAS mounts do take some time to populate the file size column, but my truenas one is the only one that goes on and on for ever.

Windows network protocols is a very chatty - especially SMB1 - it got better with SMB2.

I suggest you comment the mount in your fstab.

Then create a mount unit and use a complementary automount unit to activate the share when the folder is accessed. Doing so you can configure an activity timeout which then will unmount the share.

If the issue persist - it is likely a configuration on your server which keeps the connection alive - e.g. SMB1 aka NT1

These mount options is known to bo possible troublemakers.

Warning: Using uid and/or gid as mount options may cause I/O errors, it is recommended to set/check correct File permissions and attributes instead.
– Samba - ArchWiki

Am i getting old, where is this?

Then try hiding that column for that certain directories:

  1. Turn on per directory settings:
    :hamburger: → Configure → Configure dolphin

On the General screen, in the Behaviour make sure Remember display style for each folder is selected:

Click OK to save and close the window.

  1. Next, open the directory, and Right-Click somewhere oon the column headings, and deselecting the Size option:

Restart KDE, or reboot, and see if it helped.

If that didn’t help, sorry.

:sob:

But I’m out of ideas then.

1 Like

Yea, sorry my bad i was looking for a setting called exactly “per-folder details view”. I already have all my folders as individual setups and i did try removing the size column but it still wanted to do the same.
I was wondering if i tinkered with a similar setting it might help, but it didn’t matter what i changed here it still does it. Thx for your support though :slight_smile:
ksnip_20221201-135358

All interesting stuff. I shall give it a rest for now, it hurts my head just thinking about going back to “how to mount a nas”. But i shall take a look later, thx.

1 Like

On your TrueNAS Core server:

System → Tuneables → Add

Variable: vfs.zfs.arc.meta_min
Value: 4294967296
Type: sysctl
Comment: Allow wider metadata retention in ARC

The changes will apply upon rebooting the server, or you can immediately apply it with the following command on the server:

sysctl vfs.zfs.arc.meta_min=4294967296

The next time your ARC fills up with metadata, it should remain cache’d for significantly longer.

The first time you won’t see any difference. However, keep using your SMB shares, and over time you’ll notice it’s more responsive; less time spent on crawling your server’s drives.

You can even force metadata into the ARC by issuing a find command on the server, such as:

find /mnt/poolname > /dev/null

And,

du -hs /mnt/poolname

Use “sudo” if logged via SSH as a regular user.

(The above two commands are not necessary. In fact, I’d skip them for now. You don’t want to waste this on iocage. Just create the Tuneable and apply the sysctl value without having to reboot first.)


Use cache=loose in the mount parameters:

If you’re the only person accessing the SMB share(s), you can also safely use cache=loose rather than cache=strict in the mount options for better performance. (This makes a huge difference.) You won’t notice the effect until after some usage, as your client will have more data and metadata cache’d in local RAM.
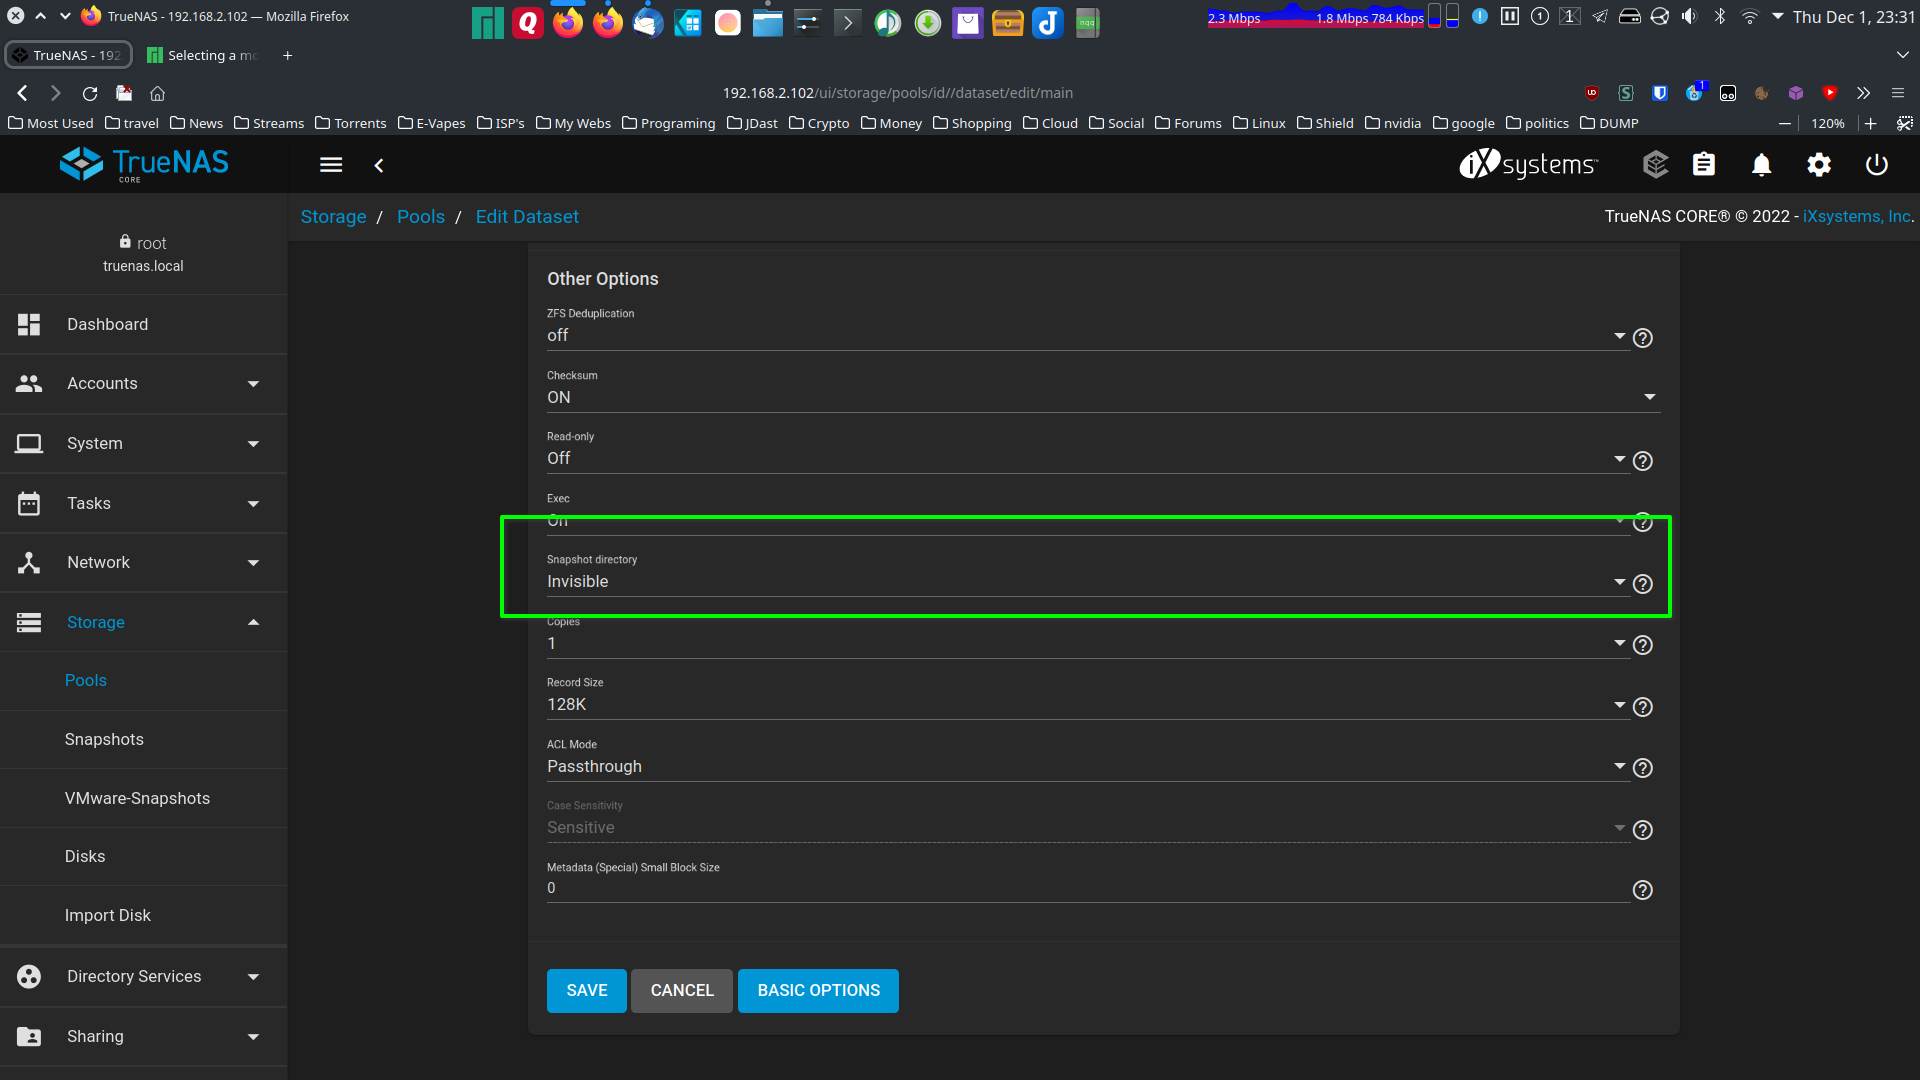

IMPORTANT EDIT:

You shouldn’t be sharing the root dataset via SMB. Bad practice, and can bump into permission issues. Plus, you’re forcing the server to waste cache on metadata that is almost pointless to the end-user, such as everything tucked under iocage.

Instead, share a child dataset or specific dataset(s) with files you need to access over SMB. The fact that you have the entirety of iocage exposed via SMB is only making your issue worse. If you really need to access everything under iocage via SMB (for some reason), then create a separate share for it; or just access it via SSH and/or the iocage command on the server.

Many thx for your time spent on the response :smile:

I understand how to do just about everything you posted (which amazes me ^^ Although not sure what ARC is but i have google).

This is a thrown together nas built from junk. Its my first time and its in a bit of a muddle, however, i never really intended to use it this way in the long term. It was experimental. I am about to buy some WD reds+ or Ironwolf pro’s to go in (im pondering about a complete new build as well, but not sure), anyhow, when i get the new drives all this will be wiped and i will re-build/re-install. Obviously, i will keep a mind on your post when building it.

For now i can try the first part of your post. Thank you.

This isn’t the case, whether for Dolphin or the command-line.

The hidden .zfs “folder” is just a convenient way to present the snapshots that exist on a ZFS dataset, in which it can also be exposed to an SMB client. (This is a way to bridge a “block-based” filesystem with software and layers that are “file-based”.)

However, unless you explicitly navigate or target this special “folder”, no software will traverse it.

If you look through this special folder on the server itself, you’ll notice that the same file across different snapshots uses the same inode number.


Your screenshot shows strange behavior. Even with hidden items visible, the special .zfs “folder” should not be visible.

It should, i purposefully made it visible. As i said this is an experiment, a learning process. I wanted to see what was going on inside .zfs and i find it easiest to use GUI file explorer to browse files.

How?

Whether using a graphical file manager (Windows Explorer, Dolphin, Nemo, etc) or the terminal, this “folder” should not be visible nor listed, even if you enable “view hidden items” or use the -a flag in a ls command.


Even when doing tests, you don’t want to stray too far from defaults or best practices, otherwise you’ll go off on tangents and not get a fair idea of what to experience when you use it in your daily workflow.


To browse within the special .zfs folder, you are expected (by design) to manually type the path in the file browser’s address bar or in the terminal.

It’s not meant to be casually traversed or entered by normal means, even if you issue recursive commands.

This is why, for example, if you issue a find command on the dataset or share, it will by default look in the entire dataset recursively, yet it will not traverse into the special .zfs “folder”. However, if you issue the same exact find command, but specifically target .zfs, then it will indeed crawl through all your snapshots.

This is all by design from upstream ZFS.

The same is also true on the server itself. It’s not limited to SMB or NFS shares.

Well , i have made them all invisible now.

I have also done all your suggestions from above. I think it is starting to populate some of the deeper folders and it seems to be working its way up the hierarchy, im not 100% sure yet, but i shall just leave it open and indexing through the NAS for the evening and see what happens.

1 Like