These last few weeks I’ve noticed a weird trend. While Gnome and Mutter are taxing a little bit more resources than they typically do (not a major issue), I am seeing an enormous ~20 GBs worth of RAM consumption that my system monitors (including CLI tools like top, bashtop, and gotop) don’t indicate the offending services under their process lists even when sorted in descending order according to memory.
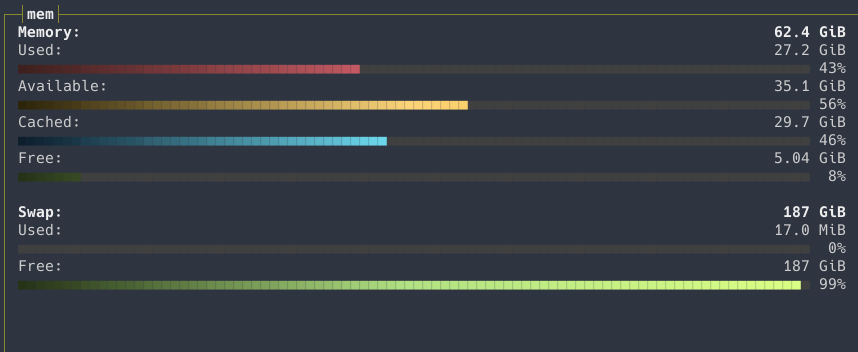
My machine has 64 GBs of RAM. About 30 minutes ago it was showing 80%. So I was almost bottoming out. There was 5GBs of swap file consumed as well. I have a lot of Chrome tabs. So I closed them all. I saved all my tabs into bookmarks and shut down Chrome. That freed up 20%. That’s great. But it was then still sitting at 60%. I didn’t have many other apps or services open but I closed them all just to make sure. 41% of the RAM was still occupied. The only major app left open was Gnome showing 5.1GBs. I guess it has a big memory leak, perhaps introduced in v47.x. So I killed Gnome, freeing up the 5GBs. From GDM I re-logged into my Gnome session. Gnome was then showing 500 MBs which is more reasonable and aligns with what most would expected HOWEVER Gnome System Monitor and my CLI tools were still showing 34% RAM occupied even at this clean slate. Everything else was idle.
Only when I reboot does the cache completely flush and Gnome System Monitor shows 6% memory consumption which is where it really should be.
I can’t account for what is consuming all this memory at 4 days of uptime. I certainly hope my Manjaro box isn’t compromised by a ghost app installed which contains some kind of novel rogue rootkit targetting Linux users. I suppose it might not be an official Manjaro/AUR package, could be a Flatpack or Snap, although I don’t have many of those.
What other information could I provide to help troubleshoot and get to the bottom of this unusual behavior?
inxi -Fazy
$ inxi -Fazy
System:
  Kernel: 6.12.1-4-MANJARO arch: x86_64 bits: 64 compiler: gcc v: 14.2.1
    clocksource: tsc avail: acpi_pm
    parameters: BOOT_IMAGE=/boot/vmlinuz-6.12-x86_64
    root=UUID=d8f51c21-a5ce-4611-973c-b7d694ae22a1 rw apparmor=1
    security=apparmor resume=UUID=6a544b3a-7b7d-4fc0-b121-0f55042fc081
    udev.log_priority=3 video=vesafb:mode=3840x1600-32,mtrr:3,ywrap
  Desktop: GNOME v: 47.2 tk: GTK v: 3.24.43 wm: gnome-shell
    tools: gsd-screensaver-proxy avail: i3lock,lxlock,swaylock dm: 1: GDM v: 47.0
    2: LightDM v: 1.32.0 note: stopped 3: SDDM note: stopped Distro: Manjaro
    base: Arch Linux
Machine:
  Type: Desktop System: ASUS product: N/A v: N/A serial: <superuser required>
  Mobo: ASUSTeK model: PRIME H670-PLUS D4 v: Rev 1.xx
    serial: <superuser required> part-nu: SKU uuid: <superuser required>
    UEFI: American Megatrends v: 2014 date: 10/14/2022
CPU:
  Info: model: 13th Gen Intel Core i5-13600K bits: 64 type: MST AMCP
    arch: Raptor Lake gen: core 13 level: v3 note: check built: 2022+
    process: Intel 7 (10nm) family: 6 model-id: 0xB7 (183) stepping: 1
    microcode: 0x12B
  Topology: cpus: 1x dies: 1 clusters: 8 cores: 14 threads: 20 mt: 6 tpc: 2
    st: 8 smt: enabled cache: L1: 1.2 MiB desc: d-8x32 KiB, 6x48 KiB; i-6x32
    KiB, 8x64 KiB L2: 20 MiB desc: 6x2 MiB, 2x4 MiB L3: 24 MiB desc: 1x24 MiB
  Speed (MHz): avg: 800 min/max: 800/5100:3900 scaling: driver: intel_pstate
    governor: powersave cores: 1: 800 2: 800 3: 800 4: 800 5: 800 6: 800 7: 800
    8: 800 9: 800 10: 800 11: 800 12: 800 13: 800 14: 800 15: 800 16: 800
    17: 800 18: 800 19: 800 20: 800 bogomips: 139820
  Flags: avx avx2 ht lm nx pae sse sse2 sse3 sse4_1 sse4_2 ssse3 vmx
  Vulnerabilities:
  Type: gather_data_sampling status: Not affected
  Type: itlb_multihit status: Not affected
  Type: l1tf status: Not affected
  Type: mds status: Not affected
  Type: meltdown status: Not affected
  Type: mmio_stale_data status: Not affected
  Type: reg_file_data_sampling mitigation: Clear Register File
  Type: retbleed status: Not affected
  Type: spec_rstack_overflow status: Not affected
  Type: spec_store_bypass mitigation: Speculative Store Bypass disabled via
    prctl
  Type: spectre_v1 mitigation: usercopy/swapgs barriers and __user pointer
    sanitization
  Type: spectre_v2 mitigation: Enhanced / Automatic IBRS; IBPB: conditional;
    RSB filling; PBRSB-eIBRS: SW sequence; BHI: BHI_DIS_S
  Type: srbds status: Not affected
  Type: tsx_async_abort status: Not affected
Graphics:
  Device-1: Advanced Micro Devices [AMD/ATI] Navi 23 [Radeon RX 6600/6600
    XT/6600M] vendor: Sapphire driver: amdgpu v: kernel arch: RDNA-2
    code: Navi-2x process: TSMC n7 (7nm) built: 2020-22 pcie: gen: 4
    speed: 16 GT/s lanes: 16 ports: active: DP-3 empty: DP-1, DP-2, HDMI-A-1,
    Writeback-1 bus-ID: 03:00.0 chip-ID: 1002:73ff class-ID: 0300
  Device-2: Logitech C922 Pro Stream Webcam driver: snd-usb-audio,uvcvideo
    type: USB rev: 2.0 speed: 480 Mb/s lanes: 1 mode: 2.0 bus-ID: 1-7:3
    chip-ID: 046d:085c class-ID: 0102 serial: <filter>
  Display: wayland server: X.org v: 1.21.1.14 with: Xwayland v: 24.1.4
    compositor: gnome-shell driver: X: loaded: amdgpu
    unloaded: modesetting,radeon alternate: fbdev,vesa dri: radeonsi
    gpu: amdgpu display-ID: 0
  Monitor-1: DP-3 model: LG (GoldStar) HDR WQHD serial: <filter> built: 2018
    res: 3840x1600 dpi: 111 gamma: 1.2 size: 879x366mm (34.61x14.41")
    diag: 952mm (37.5") modes: max: 3840x1600 min: 640x480
  API: EGL v: 1.5 hw: drv: amd radeonsi platforms: device: 0 drv: radeonsi
    device: 1 drv: swrast gbm: drv: kms_swrast surfaceless: drv: radeonsi
    wayland: drv: radeonsi x11: drv: radeonsi
  API: OpenGL v: 4.6 compat-v: 4.5 vendor: amd mesa v: 24.2.8-arch1.1
    glx-v: 1.4 direct-render: yes renderer: AMD Radeon RX 6600 XT (radeonsi
    navi23 LLVM 18.1.8 DRM 3.59 6.12.1-4-MANJARO) device-ID: 1002:73ff
    memory: 7.81 GiB unified: no display-ID: :0.0
Audio:
  Device-1: Intel Alder Lake-S HD Audio vendor: ASUSTeK driver: snd_hda_intel
    v: kernel alternate: snd_soc_avs,snd_sof_pci_intel_tgl bus-ID: 00:1f.3
    chip-ID: 8086:7ad0 class-ID: 0403
  Device-2: Advanced Micro Devices [AMD/ATI] Navi 21/23 HDMI/DP Audio
    driver: snd_hda_intel v: kernel pcie: gen: 4 speed: 16 GT/s lanes: 16
    bus-ID: 03:00.1 chip-ID: 1002:ab28 class-ID: 0403
  Device-3: Logitech C922 Pro Stream Webcam driver: snd-usb-audio,uvcvideo
    type: USB rev: 2.0 speed: 480 Mb/s lanes: 1 mode: 2.0 bus-ID: 1-7:3
    chip-ID: 046d:085c class-ID: 0102 serial: <filter>
  API: ALSA v: k6.12.1-4-MANJARO status: kernel-api with: aoss
    type: oss-emulator tools: alsactl,alsamixer,amixer
  Server-1: sndiod v: N/A status: off tools: aucat,midicat,sndioctl
  Server-2: JACK v: 1.9.22 status: off tools: N/A
  Server-3: PipeWire v: 1.2.7 status: off with: pipewire-media-session
    status: active tools: pw-cli
  Server-4: PulseAudio v: 17.0 status: active with: pulseaudio-alsa
    type: plugin tools: pacat,pactl,pavucontrol
Network:
  Device-1: Realtek RTL8125 2.5GbE vendor: ASUSTeK driver: r8169 v: kernel
    pcie: gen: 2 speed: 5 GT/s lanes: 1 port: 3000 bus-ID: 07:00.0
    chip-ID: 10ec:8125 class-ID: 0200
  IF: enp7s0 state: up speed: 1000 Mbps duplex: full mac: <filter>
  Info: services: NetworkManager, sshd, systemd-timesyncd, wpa_supplicant
Bluetooth:
  Device-1: ASUSTek ASUS USB-BT500 driver: btusb v: 0.8 type: USB rev: 1.1
    speed: 12 Mb/s lanes: 1 mode: 1.1 bus-ID: 1-10.2.4:21 chip-ID: 0b05:190e
    class-ID: e001 serial: <filter>
  Report: btmgmt ID: hci0 rfk-id: 3 state: up address: <filter> bt-v: 5.1
    lmp-v: 10 status: discoverable: no pairing: no class-ID: 6c0104
RAID:
  Hardware-1: Intel Volume Management Device NVMe RAID Controller Intel
    driver: vmd v: 0.6 port: N/A bus-ID: 00:0e.0 chip-ID: 8086:a77f rev:
    class-ID: 0104
Drives:
  Local Storage: total: 6.6 TiB used: 1.32 TiB (20.1%)
  SMART Message: Required tool smartctl not installed. Check --recommends
  ID-1: /dev/nvme0n1 maj-min: 259:0 vendor: Western Digital model: WD BLACK
    SN850X HS 1000GB size: 931.51 GiB block-size: physical: 512 B
    logical: 512 B speed: 63.2 Gb/s lanes: 4 tech: SSD serial: <filter>
    fw-rev: 620311WD temp: 35.9 C scheme: GPT
  ID-2: /dev/sda maj-min: 8:0 vendor: Seagate model: WDC WDS200T2B0A-00SM50
    size: 1.82 TiB block-size: physical: 512 B logical: 512 B speed: 6.0 Gb/s
    tech: SSD serial: <filter> fw-rev: 20WD scheme: GPT
  ID-3: /dev/sdb maj-min: 8:16 vendor: Crucial model: M4-CT256M4SSD2
    size: 238.47 GiB block-size: physical: 512 B logical: 512 B speed: 6.0 Gb/s
    tech: SSD serial: <filter> fw-rev: 000F scheme: MBR
  ID-4: /dev/sdc maj-min: 8:32 vendor: Seagate model: ST4000DM004-2CV104
    size: 3.64 TiB block-size: physical: 4096 B logical: 512 B speed: 6.0 Gb/s
    tech: HDD rpm: 5425 serial: <filter> fw-rev: 0001 scheme: GPT
Partition:
  ID-1: / raw-size: 743.72 GiB size: 730.97 GiB (98.29%)
    used: 129.46 GiB (17.7%) fs: ext4 dev: /dev/nvme0n1p2 maj-min: 259:2
  ID-2: /boot/efi raw-size: 300 MiB size: 299.4 MiB (99.80%)
    used: 288 KiB (0.1%) fs: vfat dev: /dev/nvme0n1p3 maj-min: 259:3
  ID-3: /home raw-size: 1.82 TiB size: 1.79 TiB (98.37%)
    used: 1.2 TiB (66.9%) fs: ext4 dev: /dev/sda1 maj-min: 8:1
Swap:
  Kernel: swappiness: 60 (default) cache-pressure: 100 (default) zswap: no
  ID-1: swap-1 type: file size: 512 MiB used: 2.7 MiB (0.5%) priority: -2
    file: /swapfile
  ID-2: swap-2 type: partition size: 187.5 GiB used: 17.9 MiB (0.0%)
    priority: -3 dev: /dev/nvme0n1p1 maj-min: 259:1
Sensors:
  System Temperatures: cpu: 32.0 C mobo: N/A gpu: amdgpu temp: 33.0 C
    mem: 30.0 C
  Fan Speeds (rpm): N/A gpu: amdgpu fan: 0
Info:
  Memory: total: 64 GiB available: 62.54 GiB used: 28.08 GiB (44.9%)
  Processes: 468 Power: uptime: 4d 16h 57m states: freeze,mem,disk
    suspend: deep avail: s2idle wakeups: 0 hibernate: platform avail: shutdown,
    reboot, suspend, test_resume image: 24.99 GiB services: gsd-power,
    power-profiles-daemon, upowerd Init: systemd v: 256 default: graphical
    tool: systemctl
  Packages: 2369 pm: pacman pkgs: 2332 libs: 444
    tools: gnome-software,pamac,yay pm: flatpak pkgs: 30 pm: snap pkgs: 7
    Compilers: clang: 18.1.8 gcc: 14.2.1 Shell: Zsh v: 5.9 running-in: foot
    inxi: 3.3.36