Since yesterday I noticed that my system seem to be processing something periodically, even when idle. By processing I mean that the fan runs like when the CPU is processing something. I even tried to close all process and still the system started processing something periodically. When I try to open just the System Monitor it rarely goes above 2% of CPU and there is no peak of other processes during the strange processing.
Do you know what might be going on?
I’m running the latest stable release of Manjaro 21.1.5 and here it is my inix -F:
Your post seems contradictory, you notice that system seems to be processing something periodically, but then you say there is no activity when monitoring, so maybe explain what you mean. What is “processing”?
Sorry about that. What I meant is that the fan runs like when the CPU is processing something but I can’t pinpoint what is exactly making the fan run. I notice it because it runs for a few seconds every other minute.
It didn’t do this before. I started noticing this behavior yesterday or the day before. I even tried to boot Gnome and XFCE from a usb drive and it does the same thing. It’s really annoying to work like this. My system is not that old and the room temperature is 22.4 ºC.
I’ll try to boot a older version of Gnome to see what happens.
The command s-tui shows that the temperature stays constant and the cores’ temperature is always bellow 50 ºC. The fan’s graph show activity equally spaced like I’ve said.
I’ve try booting Gnome Manjaro 20.2 from a usb drive and this issue doesn’t appear. I assume it could be a Kernel problem, so I tried booting other Linux kernels but it didn’t work. I don’t want to clean install a older version of Manjaro just to fix this problem.
This might be a kernel thing then, related to your hardware, I don’t know. 5.9 is old yes and you can’t have it anymore from Manjaro. Try other kernels, it is easy to switch from Manjaro setting, probably one works better with your hardware (maybe 5.4).
In my system I used to have to add i915 to MODULES inside /etc/mkinitcpio.conf to load the integrated GPU drivers earlier to avoid a black screen. I notice that now with the latest Manjaro version, it boots normally without making this change.
Yesterday when I undid the change it didn’t do anything, but today when I booted the problem was gone. At least until now. I don’t know if this two things were related, but it was the only non-standard change that I make to my Manjaro installation.
I’ll wait a bit and mark this as solved if it stays this way.
Yeah @omano, I tried the 5.4 and it still has this behavior. I think that peak appeared when I open Screenshot to take the screenshot. What bothers me is that periodic fan activation when I’m not doing anything.
I’ll take a look at the UEFI firmware. I was also thinking about using thinkfan but I don’t want to break my system.
I’m not quite sure how to read this, but I noticed that when temp1 in thinkpad-isa-0000 and temp1 in acpitz-acpi-0 come near 50 ºC the fan kicks in. I even think that they are from the same sensor. I can’t figure out what they are measuring. It may be an hardware problem, but I have a feeling that it isn’t.
“Once upon a time” – it was dust in the cooler and fan of my cpu. So think of cleaning it once in a year. (with a vacuum cleaner)
(Very seldom the problem is a separation of CPU and cooler. Then you have to remount the cooler to the CPU)
Something weird I noticed is your fan RPM, in s-tui it was showing near 9000 RPM, here it says 14000 RPM to me this is too high to be true.
But as I said in my second comment
If your fan starts to ramp up at 50° that makes sense.
Opening, and cleaning the cooling module insides after disassembling it itself (and cleaning/reapplying thermal paste if you completely remove the thermal module, but you probably can get away with that, if you can remove the thermal module cover to be able to clean inside and remove dust from the heatsink itself) is not really something everybody is willing to do.
You could blow some pressured air into it but that wouldn’t really clean it.
I’ve tried again booting Manjaro 20.2 and the same problem arose after all. I conclude that the laptop is simply getting hotter like @omano said , so it’s not a software problem. Because this started happening after an update, I thought both things were related. The problem of coincidence. Some component should be getting progressively hotter even when idle and when it reached 50 ºC it started the fan.
I’ve seen that use a cooling pad does the trick. I’ll go with that for now.
 .
. . I tried again what
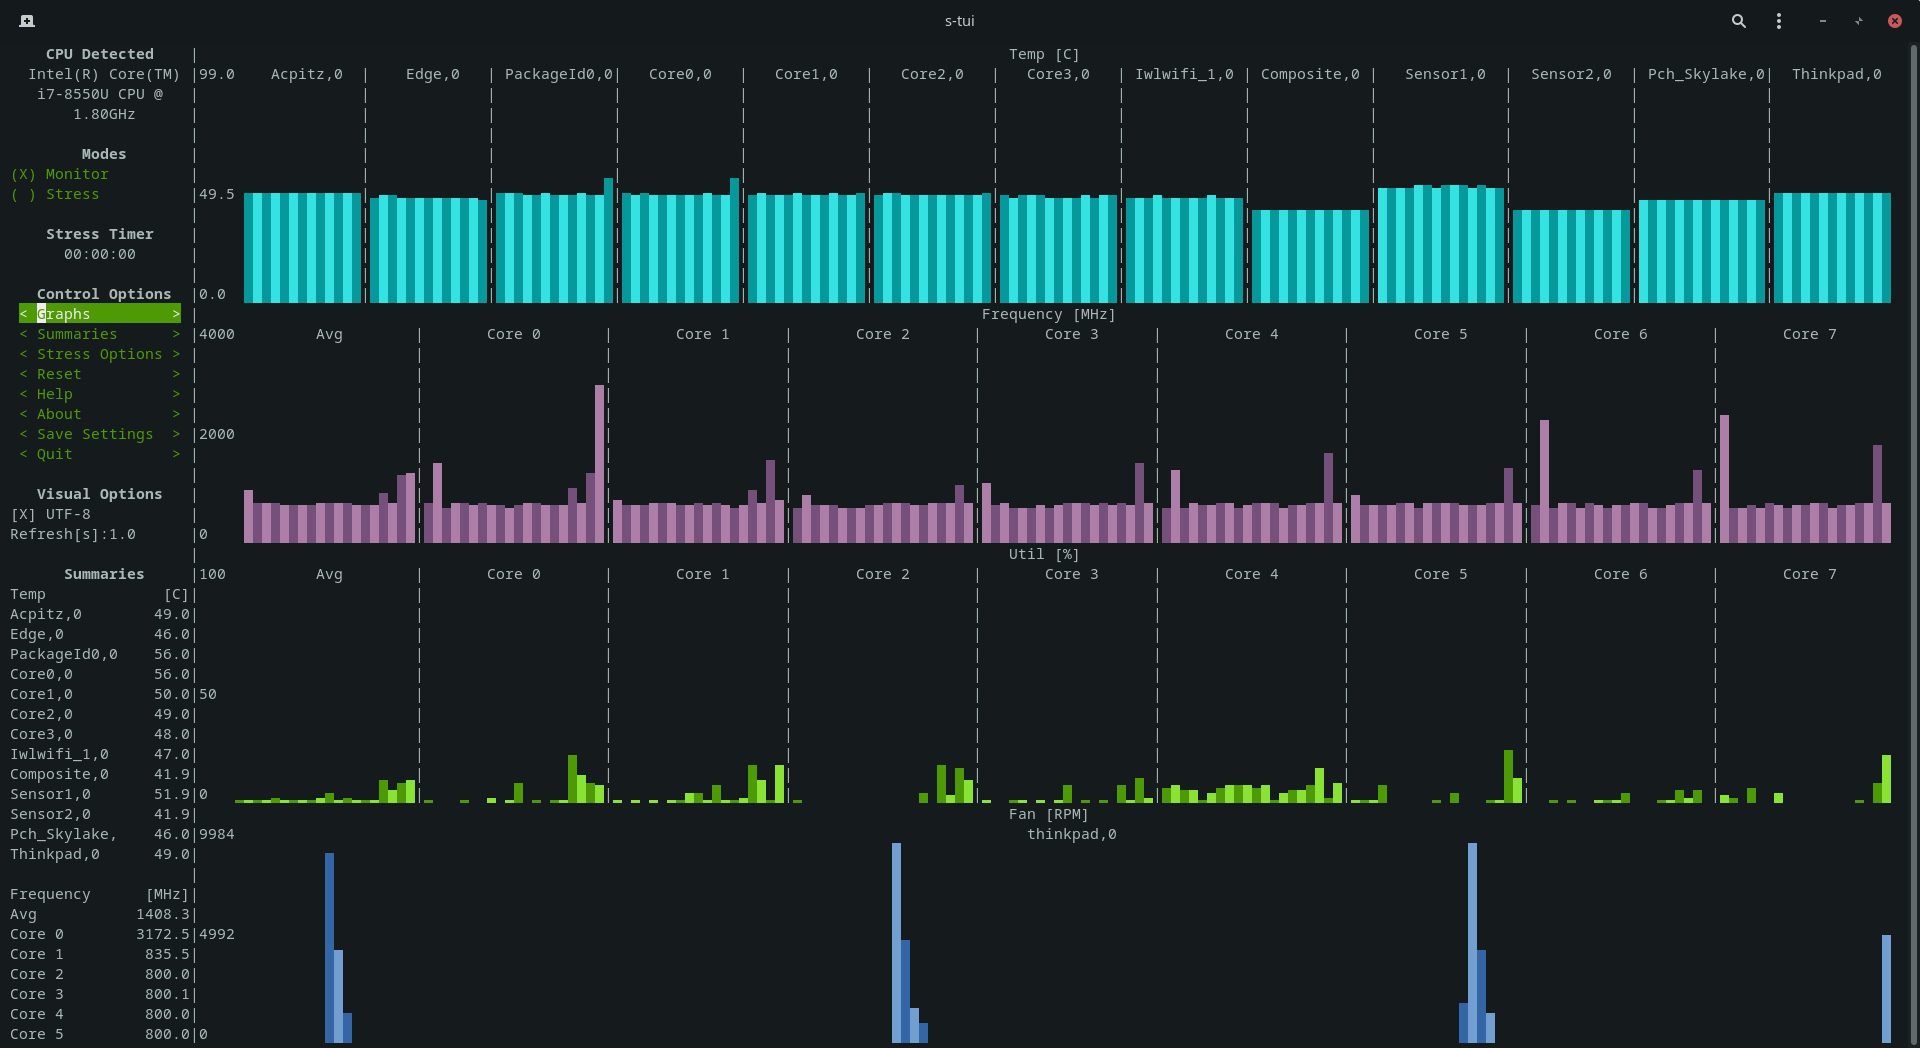
 (with a vacuum cleaner)
 , so it’s not a software problem. Because this started happening after an update, I thought both things were related. The problem of coincidence. Some component should be getting progressively hotter even when idle and when it reached 50 ºC it started the fan.