Hi,
I occasionally encounter an issue with pamac-manager (GUI) on Manjaro where the interface gets stuck while performing an AUR update check. This seems intermittent, and I do not know how to reproduce consistently.
Symptoms:
-
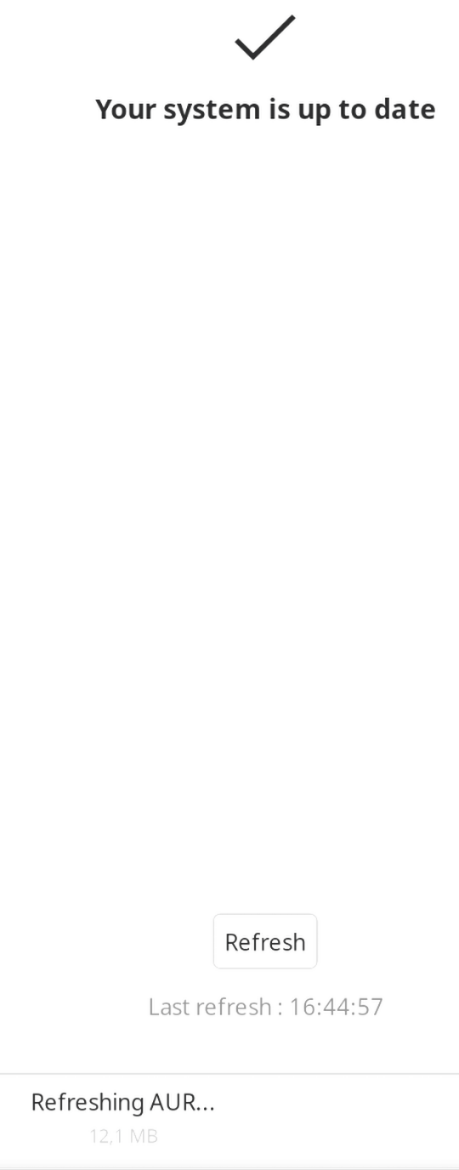
GUI shows “Refreshing AUR” indefinitely.
-
Status bar remains stuck on “Check Updates”.
-
Logs are inaccessible in the GUI.
-
The pamac GUI says “up-to-date” even when updates are available (e.g.,
firefox 146.0-1 -> 146.0.1-1). -
CLI commands work correctly (
pamac checkupdates --aur)
ps aux | grep pamac
jorgecpd    2436  0.0  0.0 838360 19160 ?        Ssl  dez18   0:00 /usr/bin/pamac-tray-plasma
jorgecpd  999486  0.0  0.4 3126620 139960 ?      Ssl  dez22   0:57 /usr/bin/pamac-manager --gapplication-service
jorgecpd 2096616  0.0  0.0   6764  4200 pts/1    S+   16:38   0:00 grep pamac
ls -l /var/lib/pacman/db.lck
ls: cannot access '/var/lib/pacman/db.lck': No such file or directory
pamac checkupdates --aur
1 available update:
firefox  146.0-1 -> 146.0.1-1  extra
dbus-monitor --session "sender='org.manjaro.pamac'"
signal time=1766594606.835642 sender=org.freedesktop.DBus -> destination=:1.1540 serial=4294967295 path=/org/freedesktop/DBus; interface=org.freedesktop.DBus; member=NameAcquired
   string ":1.1540"
signal time=1766594606.835662 sender=org.freedesktop.DBus -> destination=:1.1540 serial=4294967295 path=/org/freedesktop/DBus; interface=org.freedesktop.DBus; member=NameLost
   string ":1.1540"
sudo strace -f -e poll,epoll_wait,futex -p $(pgrep -f pamac-manager)
[pid 999497] futex(0x7f695b42ab00, FUTEX_WAIT_BITSET_PRIVATE, 2, NULL, FUTEX_BITSET_MATCH_ANY <unfinished ...>
[pid 999492] futex(0x558b2ed187d0, FUTEX_WAIT_PRIVATE, 1, NULL <unfinished ...>
[pid 999491] futex(0x558b2c7925b0, FUTEX_WAIT_PRIVATE, 8, NULL
sudo gdb -p $(pgrep -f pamac-manager)
info threads
  Id   Target Id                                            Frame
* 1    Thread 0x7f6959692080 (LWP 999486) "pamac-manager"   0x00007f695be9f002 in ?? () from /usr/lib/libc.so.6
  2    Thread 0x7f693f38a6c0 (LWP 999497) "async-io"        0x00007f695bf1872d in syscall () from /usr/lib/libc.so.6
  3    Thread 0x7f693f58b6c0 (LWP 999496) "gly-global-exec" 0x00007f695b178bb3 in ?? () from /usr/lib/libglycin-2.so.0
  4    Thread 0x7f693ffff6c0 (LWP 999495) "dconf worker"    0x00007f695be9f002 in ?? () from /usr/lib/libc.so.6
  5    Thread 0x7f69553ac6c0 (LWP 999493) "gdbus"           0x00007f695be9f002 in ?? () from /usr/lib/libc.so.6
  6    Thread 0x7f6955bad6c0 (LWP 999492) "pool-spawner"    0x00007f695bf1872d in syscall () from /usr/lib/libc.so.6
  7    Thread 0x7f69563de6c0 (LWP 999491) "[pango] fontcon" 0x00007f695bf1872d in syscall () from /usr/lib/libc.so.6
  8    Thread 0x7f6956f286c0 (LWP 999490) "gmain"           0x00007f695be9f002 in ?? () from /usr/lib/libc.so.6
- All GUI threads exist but are stuck in futex waits.
- CLI backend works correctly, so this appears to be a frontend-only issue.
- No debug symbols are available in the shipped package, so backtraces cannot resolve to Vala functions.
inxi -zv8
System:
Kernel: 6.18.2-1-MANJARO arch: x86_64 bits: 64 compiler: gcc v: 15.2.1
clocksource: tsc avail: hpet,acpi_pm
parameters: BOOT_IMAGE=/@/boot/vmlinuz-6.18-x86_64
root=UUID=67c4e3fb-311e-4604-9383-d9cc274cf0fa rw rootflags=subvol=@
quiet splash udev.log_priority=3
Desktop: KDE Plasma v: 6.5.4 tk: Qt v: N/A info: frameworks v: 6.21.0
wm: kwin_wayland vt: 1 dm: SDDM Distro: Manjaro base: Arch Linux
Machine:
Type: Desktop System: ASUS product: N/A v: N/A serial: <superuser required>
Mobo: ASUSTeK model: ROG CROSSHAIR VIII FORMULA v: Rev X.0x
serial: <superuser required> part-nu: SKU uuid: <superuser required>
Firmware: UEFI vendor: American Megatrends v: 5002 date: 01/13/2025
Battery:
ID-1: hidpp_battery_0 charge: 8% condition: N/A volts: 3.66 min: N/A
model: Logitech G502 LIGHTSPEED Wireless Gaming Mouse type: N/A
serial: <filter> charging: status: discharging cycles: N/A
Memory:
System RAM: total: 32 GiB available: 31.25 GiB used: 21.5 GiB (68.8%)
Message: For most reliable report, use superuser + dmidecode.
Array-1: capacity: 128 GiB slots: 4 modules: 4 EC: None
max-module-size: 32 GiB note: est.
Device-1: DIMM_A1 type: DDR4 detail: synchronous unbuffered (unregistered)
size: 8 GiB speed: 3200 MT/s volts: note: check curr: 1 min: 1 max: 1
width (bits): data: 64 total: 64 manufacturer: G Skill Intl
part-no: F4-3200C14-8GFX serial: N/A
Device-2: DIMM_A2 type: DDR4 detail: synchronous unbuffered (unregistered)
size: 8 GiB speed: 3200 MT/s volts: note: check curr: 1 min: 1 max: 1
width (bits): data: 64 total: 64 manufacturer: G Skill Intl
part-no: F4-3200C14-8GFX serial: N/A
Device-3: DIMM_B1 type: DDR4 detail: synchronous unbuffered (unregistered)
size: 8 GiB speed: 3200 MT/s volts: note: check curr: 1 min: 1 max: 1
width (bits): data: 64 total: 64 manufacturer: G Skill Intl
part-no: F4-3200C14-8GFX serial: N/A
Device-4: DIMM_B2 type: DDR4 detail: synchronous unbuffered (unregistered)
size: 8 GiB speed: 3200 MT/s volts: note: check curr: 1 min: 1 max: 1
width (bits): data: 64 total: 64 manufacturer: G Skill Intl
part-no: F4-3200C14-8GFX serial: N/A
PCI Slots:
Permissions: Unable to run dmidecode. Root privileges required.
CPU:
Info: model: AMD Ryzen 7 5800X bits: 64 type: MT MCP arch: Zen 3+ gen: 3
level: v3 note: check built: 2022 process: TSMC n6 (7nm) family: 0x19 (25)
model-id: 0x21 (33) stepping: 0 microcode: 0xA201030
Topology: cpus: 1x dies: 1 clusters: 1 cores: 8 threads: 16 tpc: 2
smt: enabled cache: L1: 512 KiB desc: d-8x32 KiB; i-8x32 KiB L2: 4 MiB
desc: 8x512 KiB L3: 32 MiB desc: 1x32 MiB
Speed (MHz): avg: 3786 min/max: 556/4854 boost: enabled scaling:
driver: amd-pstate-epp governor: powersave cores: 1: 3786 2: 3786 3: 3786
4: 3786 5: 3786 6: 3786 7: 3786 8: 3786 9: 3786 10: 3786 11: 3786 12: 3786
13: 3786 14: 3786 15: 3786 16: 3786 bogomips: 121605
Flags: 3dnowprefetch abm adx aes aperfmperf apic arat avic avx avx2 bmi1
bmi2 bpext cat_l3 cdp_l3 clflush clflushopt clwb clzero cmov cmp_legacy
constant_tsc cpb cpuid cqm cqm_llc cqm_mbm_local cqm_mbm_total
cqm_occup_llc cr8_legacy cx16 cx8 de debug_swap decodeassists erms
extapic extd_apicid f16c flushbyasid fma fpu fsgsbase fsrm fxsr fxsr_opt
ht hw_pstate ibpb ibrs ibs invpcid irperf lahf_lm lbrv lm mba mca mce
misalignsse mmx mmxext monitor movbe msr mtrr mwaitx nonstop_tsc nopl npt
nrip_save nx ospke osvw overflow_recov pae pat pausefilter pclmulqdq
pdpe1gb perfctr_core perfctr_llc perfctr_nb pfthreshold pge pku pni
popcnt pse pse36 rapl rdpid rdpru rdrand rdseed rdt_a rdtscp rep_good sep
sha_ni skinit smap smca smep ssbd sse sse2 sse4_1 sse4_2 sse4a ssse3
stibp succor svm svm_lock syscall tce topoext tsc tsc_scale umip
user_shstk v_spec_ctrl v_vmsave_vmload vaes vgif vmcb_clean vme vmmcall
vpclmulqdq wbnoinvd wdt x2apic xgetbv1 xsave xsavec xsaveerptr xsaveopt
xsaves xtopology
Vulnerabilities:
Type: gather_data_sampling status: Not affected
Type: ghostwrite status: Not affected
Type: indirect_target_selection status: Not affected
Type: itlb_multihit status: Not affected
Type: l1tf status: Not affected
Type: mds status: Not affected
Type: meltdown status: Not affected
Type: mmio_stale_data status: Not affected
Type: old_microcode status: Not affected
Type: reg_file_data_sampling status: Not affected
Type: retbleed status: Not affected
Type: spec_rstack_overflow mitigation: Safe RET
Type: spec_store_bypass mitigation: Speculative Store Bypass disabled via
prctl
Type: spectre_v1 mitigation: usercopy/swapgs barriers and __user pointer
sanitization
Type: spectre_v2 mitigation: Retpolines; IBPB: conditional; IBRS_FW;
STIBP: always-on; RSB filling; PBRSB-eIBRS: Not affected; BHI: Not
affected
Type: srbds status: Not affected
Type: tsa mitigation: Clear CPU buffers
Type: tsx_async_abort status: Not affected
Type: vmscape mitigation: IBPB before exit to userspace
Graphics:
Device-1: Advanced Micro Devices [AMD/ATI] Navi 31 [Radeon RX 7900 XT/7900
XTX/7900 GRE/7900M] vendor: ASUSTeK TUF Gaming driver: amdgpu v: kernel
arch: RDNA-3 code: Navi-3x process: TSMC n5 (5nm) built: 2022+ pcie:
gen: 4 speed: 16 GT/s lanes: 16 ports: active: DP-1,HDMI-A-1
empty: DP-2,DP-3,Writeback-1 bus-ID: 0d:00.0 chip-ID: 1002:744c
class-ID: 0300
Device-2: Logitech Logitech Webcam C925e driver: snd-usb-audio,uvcvideo
type: USB rev: 2.0 speed: 480 Mb/s lanes: 1 mode: 2.0 bus-ID: 3-2.2.2:7
chip-ID: 046d:085b class-ID: 0102 serial: <filter>
Display: wayland server: X.org v: 1.21.1.21 with: Xwayland v: 24.1.9
compositor: kwin_wayland driver: X: loaded: amdgpu
unloaded: modesetting,radeon alternate: fbdev,vesa dri: radeonsi
gpu: amdgpu d-rect: 5760x2160 display-ID: 0
Monitor-1: DP-1 pos: right model: LG (GoldStar) 27GN950 serial: <filter>
built: 2021 res: mode: 3840x2160 hz: 120 scale: 170% (1.7) to: 2259x1271
dpi: 163 gamma: 1.2 chroma: red: x: 0.682 y: 0.314 green: x: 0.267
y: 0.686 blue: x: 0.149 y: 0.055 white: x: 0.314 y: 0.329
size: 600x340mm (23.62x13.39") diag: 690mm (27.2") ratio: 16:9
modes: 3840x2160, 1920x1080, 1280x720, 1024x768, 800x600, 720x480,
640x480
EDID-Errors: 1: bad sync value: bad horizontal values: min: 30 max: 15
EDID-Warnings: 1: parse_edid: unknown tag 112
Monitor-2: HDMI-A-1 pos: primary,left model: Idek Iiyama PLE2607WS
serial: <filter> built: 2008 res: mode: 1920x1200 hz: 60 scale: 160% (1.6)
to: 1200x1920 dpi: 89 gamma: 1.2 chroma: red: x: 0.647 y: 0.333 green:
x: 0.282 y: 0.600 blue: x: 0.149 y: 0.071 white: x: 0.314 y: 0.329
size: 550x344mm (21.65x13.54") diag: 649mm (25.5") ratio: 16:10
modes: 1920x1200, 1920x1080, 1600x1200, 1680x1050, 1280x1024, 1440x900,
1152x864, 1280x720, 1024x768, 832x624, 800x600, 720x576, 720x480,
640x480, 720x400
API: EGL v: 1.5 hw: drv: amd radeonsi platforms: device: 0 drv: radeonsi
device: 1 drv: swrast gbm: drv: kms_swrast surfaceless: drv: radeonsi
wayland: drv: radeonsi x11: drv: radeonsi
API: OpenGL v: 4.6 compat-v: 4.5 vendor: amd mesa v: 25.3.1-arch1.2
glx-v: 1.4 direct-render: yes renderer: AMD Radeon RX 7900 XTX (radeonsi
navi31 LLVM 21.1.6 DRM 3.64 6.18.2-1-MANJARO) device-ID: 1002:744c
memory: 23.44 GiB unified: no display-ID: :1.0
API: Vulkan v: 1.4.335 layers: 2 device: 0 type: discrete-gpu name: AMD
Radeon RX 7900 XTX (RADV NAVI31) driver: mesa radv v: 25.3.1-arch1.2
device-ID: 1002:744c surfaces: N/A
Info: Tools: api: clinfo, eglinfo, glxinfo, vulkaninfo
de: kscreen-console,kscreen-doctor wl: wayland-info x11: xdpyinfo,xprop
Audio:
Device-1: Advanced Micro Devices [AMD/ATI] Navi 31 HDMI/DP Audio
driver: snd_hda_intel v: kernel pcie: gen: 4 speed: 16 GT/s lanes: 16
bus-ID: 0d:00.1 chip-ID: 1002:ab30 class-ID: 0403
Device-2: Advanced Micro Devices [AMD] Starship/Matisse HD Audio
vendor: ASUSTeK driver: snd_hda_intel v: kernel pcie: gen: 4 speed: 16 GT/s
lanes: 16 bus-ID: 0f:00.4 chip-ID: 1022:1487 class-ID: 0403
Device-3: Logitech Logitech Webcam C925e driver: snd-usb-audio,uvcvideo
type: USB rev: 2.0 speed: 480 Mb/s lanes: 1 mode: 2.0 bus-ID: 3-2.2.2:7
chip-ID: 046d:085b class-ID: 0102 serial: <filter>
API: ALSA v: k6.18.2-1-MANJARO status: kernel-api with: aoss
type: oss-emulator tools: alsactl,alsamixer,amixer
Server-1: JACK v: 1.9.22 status: off tools: N/A
Server-2: PipeWire v: 1.4.9 status: active with: 1: pipewire-pulse
status: active 2: wireplumber status: active 3: pipewire-alsa type: plugin
tools: pactl,pw-cat,pw-cli,wpctl
Network:
Device-1: Aquantia AQC111 NBase-T/IEEE 802.3bz Ethernet [AQtion]
vendor: ASUSTeK driver: atlantic v: kernel pcie: gen: 3 speed: 8 GT/s
lanes: 1 link-max: lanes: 4 port: N/A bus-ID: 05:00.0 chip-ID: 1d6a:11b1
class-ID: 0200
IF: enp5s0 state: up speed: 1000 Mbps duplex: full mac: <filter>
IP v4: <filter> type: dynamic noprefixroute scope: global
broadcast: <filter>
IP v6: <filter> type: dynamic noprefixroute scope: global
IP v6: <filter> type: noprefixroute scope: link
Device-2: Intel I211 Gigabit Network vendor: ASUSTeK driver: igb v: kernel
pcie: gen: 1 speed: 2.5 GT/s lanes: 1 port: f000 bus-ID: 06:00.0
chip-ID: 8086:1539 class-ID: 0200
IF: enp6s0 state: down mac: <filter>
Device-3: Intel Wi-Fi 6 AX200 driver: iwlwifi v: kernel pcie: gen: 2
speed: 5 GT/s lanes: 1 bus-ID: 07:00.0 chip-ID: 8086:2723 class-ID: 0280
IF: wlp7s0 state: down mac: <filter>
IF-ID-1: br-466c45b29e42 state: down mac: <filter>
IP v4: <filter> scope: global broadcast: <filter>
IF-ID-2: docker0 state: down mac: <filter>
IP v4: <filter> scope: global broadcast: <filter>
IF-ID-3: wg0-mullvad state: unknown speed: 10000 Mbps duplex: full
mac: N/A
IP v4: <filter> scope: global
IP v6: <filter> scope: global
IP v6: <filter> virtual: stable-privacy proto kernel_ll scope: link
Info: services: NetworkManager, systemd-timesyncd, wpa_supplicant
WAN IP: <filter>
Bluetooth:
Device-1: Intel AX200 Bluetooth driver: btusb v: 0.8 type: USB rev: 2.0
speed: 12 Mb/s lanes: 1 mode: 1.1 bus-ID: 1-6:3 chip-ID: 8087:0029
class-ID: e001
Report: btmgmt ID: hci0 rfk-id: 0 state: up address: <filter> bt-v: 5.2
lmp-v: 11 status: discoverable: no pairing: no class-ID: 6c0104
Device-2: Microsoft Nano Transceiver v1.0 for Bluetooth
driver: hid-generic,usbhid type: USB rev: 2.0 speed: 12 Mb/s lanes: 1
mode: 1.1 bus-ID: 3-3.1:5 chip-ID: 045e:0745 class-ID: 0300
Logical:
Message: No logical block device data found.
RAID:
Message: No RAID data found.
Drives:
Local Storage: total: 8.3 TiB used: 1.73 TiB (20.8%)
SMART Message: Required tool smartctl not installed. Check --recommends
ID-1: /dev/nvme0n1 maj-min: 259:1 vendor: Samsung model: SSD 990 PRO 4TB
size: 3.64 TiB block-size: physical: 512 B logical: 512 B speed: 63.2 Gb/s
lanes: 4 tech: SSD serial: <filter> fw-rev: 4B2QJXD7 temp: 50.9 C
scheme: GPT
ID-2: /dev/nvme1n1 maj-min: 259:0 vendor: Samsung model: SSD 990 PRO 4TB
size: 3.64 TiB block-size: physical: 512 B logical: 512 B speed: 63.2 Gb/s
lanes: 4 tech: SSD serial: <filter> fw-rev: 4B2QJXD7 temp: 49.9 C
scheme: GPT
ID-3: /dev/sda maj-min: 8:0 vendor: Samsung model: SSD 830 Series
size: 119.24 GiB block-size: physical: 512 B logical: 512 B speed: 6.0 Gb/s
tech: SSD serial: <filter> fw-rev: 3B1Q scheme: GPT
ID-4: /dev/sdb maj-min: 8:16 vendor: Samsung model: SSD 860 QVO 1TB
size: 931.51 GiB block-size: physical: 512 B logical: 512 B speed: 6.0 Gb/s
tech: SSD serial: <filter> fw-rev: 1B6Q scheme: GPT
Optical-1: /dev/sr0 vendor: HL-DT-ST model: BD-RE WH14NS40 rev: 1.05
dev-links: cdrom
Features: speed: 40 multisession: yes audio: yes dvd: yes
rw: cd-r,cd-rw,dvd-r,dvd-ram state: running
Partition:
ID-1: / raw-size: 2.59 TiB size: 2.59 TiB (100.00%) used: 184.85 GiB (7.0%)
fs: btrfs dev: /dev/nvme0n1p3 maj-min: 259:4 label: Manjaro root
uuid: 67c4e3fb-311e-4604-9383-d9cc274cf0fa
ID-2: /boot/efi raw-size: 512 MiB size: 511 MiB (99.80%)
used: 32.1 MiB (6.3%) fs: vfat dev: /dev/nvme0n1p1 maj-min: 259:2 label: EFI
uuid: 5BFB-F55D
ID-3: /home raw-size: 3.49 TiB size: 3.44 TiB (98.40%)
used: 1.52 TiB (44.1%) fs: ext4 dev: /dev/nvme1n1p1 maj-min: 259:6
label: Home uuid: 1763d5a3-375c-4e17-a4cf-f96bde772b42
ID-4: /var/cache raw-size: 2.59 TiB size: 2.59 TiB (100.00%)
used: 184.85 GiB (7.0%) fs: btrfs dev: /dev/nvme0n1p3 maj-min: 259:4
label: Manjaro root uuid: 67c4e3fb-311e-4604-9383-d9cc274cf0fa
ID-5: /var/log raw-size: 2.59 TiB size: 2.59 TiB (100.00%)
used: 184.85 GiB (7.0%) fs: btrfs dev: /dev/nvme0n1p3 maj-min: 259:4
label: Manjaro root uuid: 67c4e3fb-311e-4604-9383-d9cc274cf0fa
Swap:
Kernel: swappiness: 60 (default) cache-pressure: 100 (default) zswap: yes
compressor: zstd max-pool: 20%
ID-1: swap-1 type: partition size: 63.5 GiB used: 30.33 GiB (47.8%)
priority: -2 dev: /dev/nvme0n1p2 maj-min: 259:3 label: Swap
uuid: 2fb0f355-cde7-4eb9-9259-9822d28c5af2
Unmounted:
ID-1: /dev/nvme0n1p4 maj-min: 259:5 size: 1013.73 GiB fs: btrfs label: N/A
uuid: 2012bb20-12df-40ac-a630-2ed115853dc0
ID-2: /dev/nvme1n1p2 maj-min: 259:7 size: 150 GiB fs: btrfs
label: snapshots backup syst\xc3\xa8me
uuid: e51dc2b8-8026-4865-99e5-09216373f6af
ID-3: /dev/sda1 maj-min: 8:1 size: 16 MiB fs: <superuser required>
label: N/A uuid: N/A
ID-4: /dev/sda2 maj-min: 8:2 size: 118.5 GiB fs: ntfs label: N/A
uuid: 648AA69E8AA66C6C
ID-5: /dev/sda3 maj-min: 8:3 size: 743 MiB fs: ntfs label: N/A
uuid: FADE7F8FDE7F4345
ID-6: /dev/sdb1 maj-min: 8:17 size: 868 MiB fs: vfat label: N/A
uuid: A567-7EF7
ID-7: /dev/sdb2 maj-min: 8:18 size: 930.66 GiB fs: ext4 label: N/A
uuid: f18e7382-b9e7-4ab1-84ec-8fc5127f31d3
USB:
Hub-1: 1-0:1 info: hi-speed hub with single TT ports: 6 rev: 2.0
speed: 480 Mb/s (57.2 MiB/s) lanes: 1 mode: 2.0 chip-ID: 1d6b:0002
class-ID: 0900
Hub-2: 1-5:2 info: Genesys Logic Hub ports: 4 rev: 2.0
speed: 480 Mb/s (57.2 MiB/s) lanes: 1 mode: 2.0 power: 100mA
chip-ID: 05e3:0610 class-ID: 0900
Device-1: 1-5.3:4 info: ASUSTek AURA LED Controller type: HID
driver: hid-generic,usbhid interfaces: 2 rev: 2.0 speed: 12 Mb/s (1.4 MiB/s)
lanes: 1 mode: 1.1 power: 16mA chip-ID: 0b05:18f3 class-ID: 0300
serial: <filter>
Device-2: 1-5.4:5 info: ASUSTek AURA LED Controller type: HID
driver: hid-generic,usbhid interfaces: 1 rev: 2.0 speed: 12 Mb/s (1.4 MiB/s)
lanes: 1 mode: 1.1 power: 100mA chip-ID: 0b05:1872 class-ID: 0300
serial: <filter>
Device-3: 1-6:3 info: Intel AX200 Bluetooth type: bluetooth driver: btusb
interfaces: 2 rev: 2.0 speed: 12 Mb/s (1.4 MiB/s) lanes: 1 mode: 1.1
power: 100mA chip-ID: 8087:0029 class-ID: e001
Hub-3: 2-0:1 info: super-speed hub ports: 4 rev: 3.1
speed: 10 Gb/s (1.16 GiB/s) lanes: 1 mode: 3.2 gen-2x1 chip-ID: 1d6b:0003
class-ID: 0900
Hub-4: 3-0:1 info: hi-speed hub with single TT ports: 6 rev: 2.0
speed: 480 Mb/s (57.2 MiB/s) lanes: 1 mode: 2.0 chip-ID: 1d6b:0002
class-ID: 0900
Hub-5: 3-2:2 info: ASMedia ASM1074 High-Speed hub ports: 4 rev: 2.1
speed: 480 Mb/s (57.2 MiB/s) lanes: 1 mode: 2.0 power: 100mA
chip-ID: 174c:2074 class-ID: 0900
Device-1: 3-2.1:4 info: Advanced Card Systems ACR38 SmartCard Reader
type: smart card driver: N/A interfaces: 1 rev: 1.1
speed: 12 Mb/s (1.4 MiB/s) lanes: 1 mode: 1.1 power: 100mA
chip-ID: 072f:90cc class-ID: 0b00
Hub-6: 3-2.2:6 info: Texas Instruments TUSB8041 4-Port Hub ports: 4
rev: 2.1 speed: 480 Mb/s (57.2 MiB/s) lanes: 1 mode: 2.0 chip-ID: 0451:8142
class-ID: 0900
Device-1: 3-2.2.2:7 info: Logitech Logitech Webcam C925e type: video,audio
driver: snd-usb-audio,uvcvideo interfaces: 4 rev: 2.0
speed: 480 Mb/s (57.2 MiB/s) lanes: 1 mode: 2.0 power: 500mA
chip-ID: 046d:085b class-ID: 0102 serial: <filter>
Device-2: 3-2.2.4:30 info: LG USA Monitor Controls
type: HID,abstract (modem),CDC-data driver: cdc_acm,hid-generic,usbhid
interfaces: 4 rev: 2.0 speed: 12 Mb/s (1.4 MiB/s) lanes: 1 mode: 1.1
chip-ID: 043e:9a8a class-ID: 0a00 serial: <filter>
Hub-7: 3-3:3 info: ASMedia ASM1074 High-Speed hub ports: 4 rev: 2.1
speed: 480 Mb/s (57.2 MiB/s) lanes: 1 mode: 2.0 power: 100mA
chip-ID: 174c:2074 class-ID: 0900
Device-1: 3-3.1:5 info: Microsoft Nano Transceiver v1.0 for Bluetooth
type: keyboard,mouse,HID driver: hid-generic,usbhid interfaces: 3 rev: 2.0
speed: 12 Mb/s (1.4 MiB/s) lanes: 1 mode: 1.1 power: 100mA
chip-ID: 045e:0745 class-ID: 0300
Device-2: 3-3.2:8 info: HP HP Color LaserJet Pro M478f-9f type: printer
driver: usblp interfaces: 5 rev: 2.0 speed: 480 Mb/s (57.2 MiB/s) lanes: 1
mode: 2.0 power: 2mA chip-ID: 03f0:c52a class-ID: 0701 serial: <filter>
Hub-8: 4-0:1 info: super-speed hub ports: 4 rev: 3.1
speed: 10 Gb/s (1.16 GiB/s) lanes: 1 mode: 3.2 gen-2x1 chip-ID: 1d6b:0003
class-ID: 0900
Hub-9: 4-2:2 info: ASMedia ASM1074 SuperSpeed hub ports: 4 rev: 3.0
speed: 5 Gb/s (596.0 MiB/s) lanes: 1 mode: 3.2 gen-1x1 power: 8mA
chip-ID: 174c:3074 class-ID: 0900
Hub-10: 4-2.2:4 info: Texas Instruments TUSB8041 4-Port Hub ports: 4
rev: 3.0 speed: 5 Gb/s (596.0 MiB/s) lanes: 1 mode: 3.2 gen-1x1
chip-ID: 0451:8140 class-ID: 0900
Hub-11: 4-3:3 info: ASMedia ASM1074 SuperSpeed hub ports: 4 rev: 3.0
speed: 5 Gb/s (596.0 MiB/s) lanes: 1 mode: 3.2 gen-1x1 power: 8mA
chip-ID: 174c:3074 class-ID: 0900
Hub-12: 5-0:1 info: hi-speed hub with single TT ports: 4 rev: 2.0
speed: 480 Mb/s (57.2 MiB/s) lanes: 1 mode: 2.0 chip-ID: 1d6b:0002
class-ID: 0900
Device-1: 5-3:2 info: Logitech Lightspeed Receiver
type: keyboard,mouse,HID driver: logitech-djreceiver,usbhid interfaces: 3
rev: 2.0 speed: 12 Mb/s (1.4 MiB/s) lanes: 1 mode: 1.1 power: 98mA
chip-ID: 046d:c539 class-ID: 0300
Hub-13: 6-0:1 info: super-speed hub ports: 4 rev: 3.1
speed: 10 Gb/s (1.16 GiB/s) lanes: 1 mode: 3.2 gen-2x1 chip-ID: 1d6b:0003
class-ID: 0900
Sensors:
System Temperatures: cpu: 52.0 C mobo: 38.0 C gpu: amdgpu temp: 58.0 C
mem: 65.0 C
Fan Speeds (rpm): cpu: 887 gpu: amdgpu fan: 618
Repos:
Packages: pm: pacman pkgs: 1480 libs: 373 tools: pamac pm: flatpak pkgs: 0
Active pacman repo servers in: /etc/pacman.d/mirrorlist
1: https://mirrors.manjaro.org/repo/testing/$repo/$arch
2: https://ask4.mm.fcix.net/manjaro/testing/$repo/$arch
3: https://mirror.easyname.at/manjaro/testing/$repo/$arch
4: https://ftp.lysator.liu.se/pub/manjaro/testing/$repo/$arch
5: https://mirrors.up.pt/pub/manjaro/testing/$repo/$arch
6: https://mirror.hostiko.network/manjaro/testing/$repo/$arch
7: https://mirror.math.princeton.edu/pub/manjaro/testing/$repo/$arch
8: https://edgeuno-bog2.mm.fcix.net/manjaro/testing/$repo/$arch
Processes:
CPU top: 5 of 592
1: cpu: 10.7% command: firefox pid: 828347 mem: 4217.9 MiB (13.1%)
2: cpu: 10.4% command: firefox pid: 2094776 mem: 454.1 MiB (1.4%)
3: cpu: 9.3% command: firefox pid: 2710 mem: 868.6 MiB (2.7%)
4: cpu: 5.2% command: firefox pid: 164605 mem: 491.1 MiB (1.5%)
5: cpu: 5.1% command: firefox pid: 2105592 mem: 242.7 MiB (0.7%)
Memory top: 5 of 592
1: mem: 4217.9 MiB (13.1%) command: firefox pid: 828347 cpu: 10.7%
2: mem: 2047.0 MiB (6.3%) command: firefox pid: 50355 cpu: 3.6%
3: mem: 1796.4 MiB (5.6%) command: firefox pid: 150758 cpu: 2.4%
4: mem: 1684.2 MiB (5.2%) command: firefox pid: 831940 cpu: 0.2%
5: mem: 1641.1 MiB (5.1%) command: firefox pid: 1562442 cpu: 2.5%
Info:
Processes: 592 Power: uptime: 5d 21h 3m states: freeze,mem,disk
suspend: deep avail: s2idle wakeups: 0 hibernate: platform avail: shutdown,
reboot, suspend, test_resume image: 12.48 GiB services: org_kde_powerdevil,
power-profiles-daemon, upowerd Init: systemd v: 258 default: graphical
tool: systemctl
Compilers: gcc: 15.2.1 Shell: Zsh v: 5.9 running-in: konsole inxi: 3.3.40
~