I have Manjaro XFCE installed on my desktop PC, and the installation is rather new (about a month old). I made a separate partition for it (sda5 - sda disk is a SSD disk). I gave that partition about 29 Gb upon creation, thinking that it would probably be enough since I don’t actually keep a lot of data on the disk where the OS is installed (I have an external hard drive for that).
Yesterday, however, while I was trying to copy a bit larger video file from one folder to another, Manjaro said it ran out of space… and that I need to free it up. I looked at Gparted and indeed it looked as if I ran out of space. I was using about 28.9 out of 29 GB in total. I thought that running out of space so quickly was pretty strange, especially since my Home folder takes up only 16,6 Gb, and I don’t have many programs installed at the moment.
Thankfully, there was a large swap file (20 Gb right after sda5, so I managed to reduce this swap file and extend sda5 with that free space… of course, I did that from Live Manjaro USB installation).
So, yesterday I managed to add another 9 Gb from the swap file to sda5 and today File Manager would report that I have about 9 Gb free space. Fine enough. But then I installed Mame emulator from Pamac and lo and behold, File Manager started to show only 7 Gb free space!
I uninstalled Mame emulator from Pamac, but File Manager still shows only 7.7 Gb free space on sda5. I think that’s really strange. If I uninstalled the program that lowered the amount of free space, shouldn’t that have returned the free space to about 9 Gb? Also, why would the installation of a program such as Mame, which is only about 434 Mb cause such a big reduction in disk free space (from 9Gb to 7Gb)? I find that also quite weird.
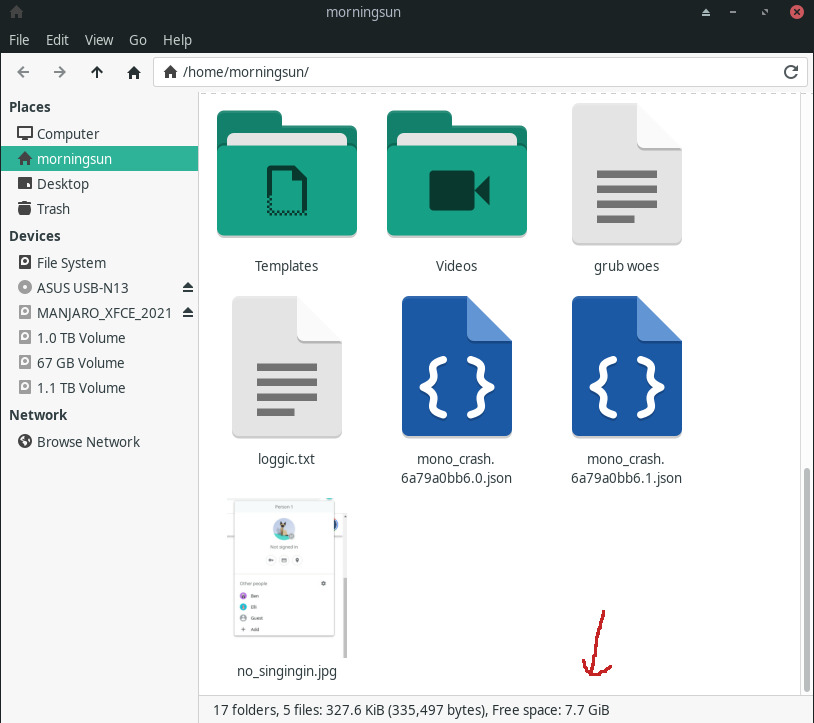
Strangely enough, GParted still reports about 9 Gb of free space on sda5. Please take a look at the screenshots. Does anyone have any idea how to find out what’s happening with free space and how to make sure that there is no virus or rogue program which is eating it up?

this is the output of inxi -Fazy
System:
  Kernel: 5.9.16-1-MANJARO x86_64 bits: 64 compiler: gcc v: 10.2.0
  parameters: BOOT_IMAGE=/boot/vmlinuz-5.9-x86_64
  root=UUID=ca2bd929-9950-4937-95a7-b61d98c0082f ro verbose apparmor=1
  security=apparmor udev.log_priority=3
  Desktop: Xfce 4.16.0 tk: Gtk 3.24.24 info: xfce4-panel wm: xfwm4 vt: 7
  dm: LightDM 1.30.0 Distro: Manjaro Linux base: Arch Linux
Machine:
  Type: Desktop Mobo: ASUSTeK model: P7P55D PRO v: Rev 1.xx serial: <filter>
  BIOS: American Megatrends v: 2101 date: 09/27/2012
CPU:
  Info: Quad Core model: Intel Core i5 750 bits: 64 type: MCP arch: Nehalem
  family: 6 model-id: 1E (30) stepping: 5 microcode: A cache: L2: 8 MiB
  flags: lm nx pae sse sse2 sse3 sse4_1 sse4_2 ssse3 vmx bogomips: 21406
  Speed: 1939 MHz min/max: 1200/2668 MHz boost: enabled Core speeds (MHz):
  1: 1939 2: 2174 3: 1987 4: 1937
  Vulnerabilities: Type: itlb_multihit status: KVM: VMX disabled
  Type: l1tf
  mitigation: PTE Inversion; VMX: conditional cache flushes, SMT disabled
  Type: mds
  status: Vulnerable: Clear CPU buffers attempted, no microcode; SMT disabled
  Type: meltdown mitigation: PTI
  Type: spec_store_bypass
  mitigation: Speculative Store Bypass disabled via prctl and seccomp
  Type: spectre_v1
  mitigation: usercopy/swapgs barriers and __user pointer sanitization
  Type: spectre_v2 mitigation: Full generic retpoline, IBPB: conditional,
  IBRS_FW, STIBP: disabled, RSB filling
  Type: srbds status: Not affected
  Type: tsx_async_abort status: Not affected
Graphics:
  Device-1: AMD Juniper PRO [Radeon HD 5750] vendor: ASUSTeK driver: radeon
  v: kernel bus-ID: 01:00.0 chip-ID: 1002:68be class-ID: 0300
  Display: x11 server: X.Org 1.20.10 driver: loaded: ati,radeon
  unloaded: modesetting alternate: fbdev,vesa display-ID: :0.0 screens: 1
  Screen-1: 0 s-res: 1920x1080 s-dpi: 96 s-size: 508x285mm (20.0x11.2")
  s-diag: 582mm (22.9")
  Monitor-1: VGA-0 res: 1920x1080 hz: 60 dpi: 102 size: 477x268mm (18.8x10.6")
  diag: 547mm (21.5")
  OpenGL: renderer: AMD JUNIPER (DRM 2.50.0 / 5.9.16-1-MANJARO LLVM 11.1.0)
  v: 3.3 Mesa 20.3.4 compat-v: 3.1 direct render: Yes
Audio:
  Device-1: Intel 5 Series/3400 Series High Definition Audio vendor: ASUSTeK
  driver: snd_hda_intel v: kernel bus-ID: 00:1b.0 chip-ID: 8086:3b56
  class-ID: 0403
  Device-2: AMD Juniper HDMI Audio [Radeon HD 5700 Series] vendor: ASUSTeK
  driver: snd_hda_intel v: kernel bus-ID: 01:00.1 chip-ID: 1002:aa58
  class-ID: 0403
  Sound Server-1: ALSA v: k5.9.16-1-MANJARO running: yes
  Sound Server-2: JACK v: 0.125.0 running: no
  Sound Server-3: PulseAudio v: 14.2 running: yes
  Sound Server-4: PipeWire v: 0.3.23 running: no
Network:
  Device-1: Realtek RTL8111/8168/8411 PCI Express Gigabit Ethernet
  vendor: ASUSTeK M4A785/P7P55 driver: r8169 v: kernel port: c800
  bus-ID: 02:00.0 chip-ID: 10ec:8168 class-ID: 0200
  IF: enp2s0 state: down mac: <filter>
  Device-2: ASUSTek USB-N13 802.11n Network Adapter (rev. B1) [Realtek
  RTL8192CU]
  type: USB driver: rtl8192cu bus-ID: 2-1.3:5 chip-ID: 0b05:17ab
  class-ID: 0000 serial: <filter>
  IF: wlp0s29u1u3 state: up mac: <filter>
  IF-ID-1: tun0 state: unknown speed: 10 Mbps duplex: full mac: N/A
Drives:
  Local Storage: total: 2.85 TiB used: 28.49 GiB (1.0%)
  SMART Message: Required tool smartctl not installed. Check --recommends
  ID-1: /dev/sda maj-min: 8:0 vendor: Samsung model: SSD 840 EVO 120GB
  size: 111.79 GiB block-size: physical: 512 B logical: 512 B speed: <unknown>
  rotation: SSD serial: <filter> rev: BB6Q scheme: MBR
  ID-2: /dev/sdb maj-min: 8:16 vendor: Western Digital model: WD10EZRX-00A8LB0
  size: 931.51 GiB block-size: physical: 4096 B logical: 512 B speed: 3.0 Gb/s
  serial: <filter> rev: 1A01 scheme: MBR
  ID-3: /dev/sdc maj-min: 8:32 type: USB vendor: Kingston
  model: DataTraveler 3.0 size: 14.41 GiB block-size: physical: 512 B
  logical: 512 B serial: <filter> scheme: MBR
  ID-4: /dev/sdd maj-min: 8:48 type: USB vendor: Western Digital
  model: WD Elements 25A1 size: 1.82 TiB block-size: physical: 512 B
  logical: 512 B serial: <filter> rev: 1005 scheme: GPT
Partition:
  ID-1: / raw-size: 38.83 GiB size: 38.1 GiB (98.11%) used: 28.49 GiB (74.8%)
  fs: ext4 dev: /dev/sda5 maj-min: 8:5
Swap:
  Kernel: swappiness: 60 (default) cache-pressure: 100 (default)
  ID-1: swap-1 type: partition size: 9.99 GiB used: 0 KiB (0.0%) priority: -2
  dev: /dev/sda6 maj-min: 8:6
Sensors:
  System Temperatures: cpu: 48.5 C mobo: 39.0 C gpu: radeon temp: 47.0 C
  Fan Speeds (RPM): cpu: 2636 psu: 0 case-1: 0 case-2: 0
  Power: 12v: 12.21 5v: N/A 3.3v: 3.39 vbat: N/A
Info:
  Processes: 236 Uptime: 41m wakeups: 0 Memory: 5.8 GiB used: 1.73 GiB (29.9%)
  Init: systemd v: 247 tool: systemctl Compilers: gcc: 10.2.0 Packages:
  pacman: 1399 lib: 432 Shell: Bash v: 5.1.0 running-in: xfce4-terminal
  inxi: 3.3.03