It depends on the hardware. 100°C is too hot for all hardware, but 70°C might be OK for your HD, so we cannnot tell you unless you provide more information, so read this:
https://archived.forum.manjaro.org/t/how-to-provide-good-information-in-your-posts/37102
and post some more information so we can see what’s really going on. Now we know the symptom of the disease, but we need some more probing to know where the origin lies…
An inxi --full --admin --verbosity=7 --filter --no-host would be the minimum required information… (Personally Identifiable Information like serial numbers and MAC addresses will be filtered out by the above command)

P.S. If you enter a bit more details in your profile, we can also see which Desktop Environment you’re using, which CPU/GPU you have, …
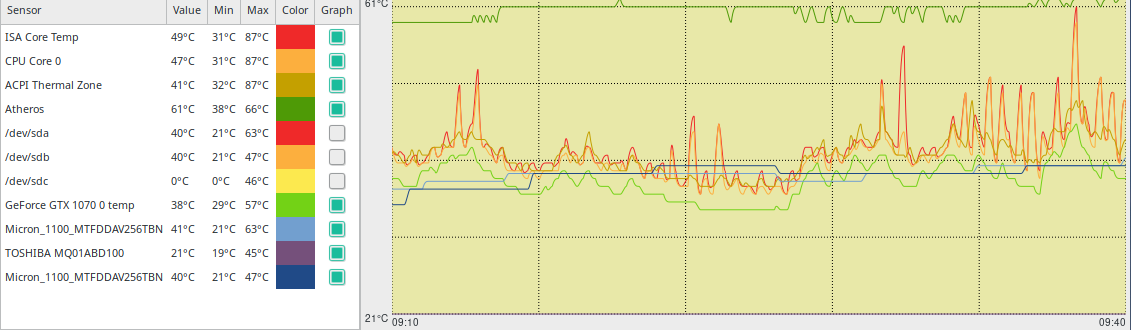
There are multiple! psensor is the easiest:
pamac install sensors
pamac install psensor
sudo sensors-detect
psensor &
and looks like this:
The most versatile (and difficult) is Conky:
pamac install conky-cairo
but you need to create a config file for your hardware like this:
conky.config =
{
  console_bar_fill   = '»',
  console_bar_unfill = ' ',

  alignment = 'top_left',
  background = false,
  border_width = 2,
  cpu_avg_samples = 2,
  -- define Manjaro colours:
  default_color = '#1abc9c',  -- Same HTML as current terminal
  color1 = '#709080',         -- Kakhi
  color2 = '#dca3a3',         -- Salmon
  color3 = '#72d5a3',         -- Light Green
  color4 = '#f0dfaf',         -- Yellow
  color5 = '#7eb2e6',         -- Metal blue
  color6 = '#a45ec1',         -- Light aubergine
  font   = 'Envy Code R:bold:size=8',
  default_outline_color = '#1abc9c',  -- Same HTML as current terminal
  default_shade_color = '#1abc9c',  -- Same HTML as current terminal
  double_buffer = true,
  draw_borders = false,
  draw_graph_borders = true,
  draw_outline = false,
  draw_shades = false,
  extra_newline = false,
  format_human_readable=true,
  gap_x = 25,
  gap_y = 25,
  minimum_height = 200,
  minimum_width = 200,
  net_avg_samples = 2,
  no_buffers = true,
  out_to_console = false,
  out_to_ncurses = false,
  out_to_stderr = false,
  out_to_x = true,
  own_window = true,
  own_window_class = 'Conky',
  own_window_type = 'normal',
  own_window_transparent = false,
  -- set transparency:
  own_window_argb_visual = true, own_window_argb_value = 100,
  show_graph_range = false,
  show_graph_scale = false,
  stippled_borders = 0,
  update_interval = 2.0,
  uppercase = false,
  use_spacer = 'none',
  use_xft = true,
  lua_load = '~/.config/conky/MyFunctions.lua',
  lua_draw_hook_post = "main",
}

conky.text = [[
${color}Info:${color1} ${scroll 32 $nodename $kernel}
${color}$hr
${color}Uptime    :${color1} $uptime
${color}Frequency :${color1} $freq ${color}MHz
#${color}RAM Usage :${color1} ${lua conky_RoundUp ${mem} }/${lua conky_RoundUp ${memmax} } ${membar 4}
${color}RAM Usage :${color1} ${mem}/${memmax} ${membar 4}
#${color}Swap Usage:${color1} ${lua conky_RoundUp ${swap} }/${lua conky_RoundUp ${swapmax} } ${swapbar 4}
${color}Swap Usage:${color1} ${swap}/${swapmax} ${swapbar 4}
${color}CPU Usage :${color1} $cpu% ${cpubar 4}
${color}Processes :${color1} $processes  ${color}Load:${color1} $loadavg
${color}Name                 CPU%   MEM%   PID
${color1} ${top name 1} ${color2} ${top cpu 1} ${top mem 1} ${top pid 1}
${color1} ${top name 2} ${color2} ${top cpu 2} ${top mem 2} ${top pid 2}
${color1} ${top name 3} ${color2} ${top cpu 3} ${top mem 3} ${top pid 3}
${color1} ${top name 4} ${color2} ${top cpu 4} ${top mem 4} ${top pid 4}
${color}$hr
${color}File systems:
${color} /           ${color1}${fs_used /}/${fs_size /} ${fs_bar 6 /}
${color} /home       ${color1}${fs_used /home}/${fs_size /home} ${fs_bar 6 /home}
${color} /media/Data ${color1}${fs_used /media/Data}/${fs_size /media/Data} ${fs_bar 6 /media/Data}\
# Don't show NAS if not mounted
${if_existing /media/NAS/home/}
${color} /media/NAS  ${color1}${fs_used /media/NAS}/${fs_size /media/NAS} ${fs_bar 6 /media/NAS}
${endif}${color}$hr
# Networking section will not show anything if no NICS are up
# Will show speed and graph per NIC if they are up
${if_existing /sys/class/net/enp3s0/operstate up}${color}Ethernet
${color}Down: ${color1}${downspeed enp3s0}s ${alignr}${color}Up: ${color1}${upspeed enp3s0}/s
${downspeedgraph enp3s0 50,200 dca3a3 ffffff -l -t} ${alignr}${color1}${upspeedgraph enp3s0 50,200 dca3a3 ffffff -l -t}
${color}Total: ${color1}${totaldown enp3s0} ${alignr}${color}Total: ${color1}${totalup enp3s0}
${endif}${if_existing /sys/class/net/wlp2s0/operstate up}${color}WiFi
${color}Down: ${color1}${downspeed wlp2s0}/s ${alignr}${color}${color}Up: ${color1}${upspeed wlp2s0}/s
${downspeedgraph wlp2s0 50,200 dddddd ffffff -l -t} ${alignr}${color1}${upspeedgraph wlp2s0 50,200 dddddd ffffff -l -t}
${color}Total: ${color1}${totaldown wlp2s0} ${alignr}${color}Total: ${color1}${totalup wlp2s0}${endif}
${color}$hr
${color}Temperature:
${color} ISA     ${color1}${exec sensors | awk ' /Package/ {print $4}'}${alignr}${alignr}${color}CPU     ${color1}${exec sensors      | grep 'Core 0'                   | awk '{print $3}'}
${color} ACPI    ${color1}${exec sensors | grep --after-context=2 'acpitz' | awk 'FNR ==3 {print $2}'}${alignr}${color}WiFi    ${color1}${exec exec sensors | grep --after-context=2 'ath10k' | awk 'FNR ==3 {print $2}'}
${color} GPU     ${color1}+${exec nvidia-settings --query=gpucoretemp 2>/dev/null | grep 'GPUCoreTemp' | grep "\[gpu:0\]" | awk '{print $4}'}0°C
${color} SSD     ${color1}+${hddtemp /dev/sda}.0°C${alignr}${color}HDD     ${color1}+${hddtemp /dev/sda}.0°C
${color2}${execgraph "sensors | grep 'Core 0' | awk '{print $3}' | cut -b2,3"}
]]
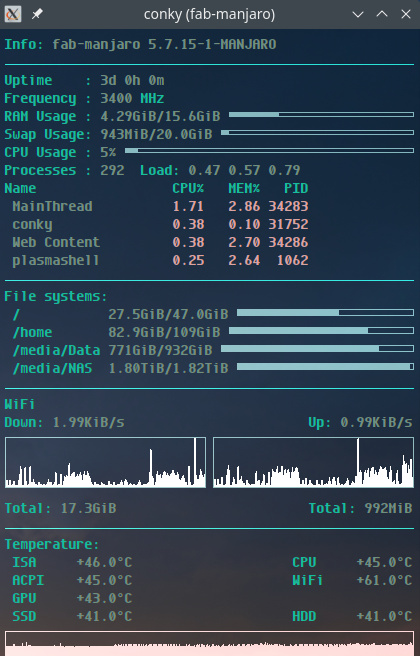
and then it looks like this:
(The above is specific to my system, but there are even more elaborate ones like here, or here, or even this one)