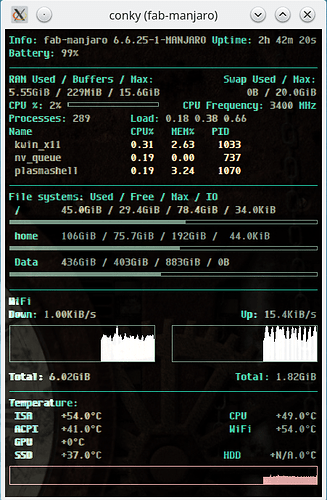
Ultra-compact
This Conky config is:
- Far from being beautiful.
- Ultra-compact by using both left and righ-alinment to cram as much info into one line.
- Grows organically larger due to bunches of IF statements:
- Shows the number of updates to install if the number of updates > 1.
- Shows WiFi, LAN speed (or both if both are active or none if in air plane mode).
- Shows which mount points are mounted, what their size, utilisation, activity is.
- Uses the Manjaro theme colours.
- etc.
Screenshot:
Code
conky.config =
{
  console_bar_fill   = '»',
  console_bar_unfill = ' ',

  alignment = 'top_left',
  background = false,
  border_width = 2,
  cpu_avg_samples = 2,
  -- define Manjaro colours:
  default_color = '#1abc9c',  -- Same HTML as current terminal
  color1 = '#709080',         -- Kakhi
  color2 = '#dca3a3',         -- Salmon
  color3 = '#72d5a3',         -- Light Green
  color4 = '#f0dfaf',         -- Yellow
  color5 = '#7eb2e6',         -- Metal blue
  color6 = '#a45ec1',         -- Light aubergine
  font   = 'Envy Code R:bold:size=8',
  default_outline_color = '#1abc9c',  -- Same HTML as current terminal
  default_shade_color = '#1abc9c',  -- Same HTML as current terminal
  double_buffer = true,
  draw_borders = false,
  draw_graph_borders = true,
  draw_outline = false,
  draw_shades = false,
  extra_newline = false,
  format_human_readable=true,
  gap_x = 25,
  gap_y = 25,
  minimum_height = 200,
  minimum_width = 200,
  net_avg_samples = 2,
  no_buffers = true, -- 2023-02-01: set to true to subtract buffer usage from RAM usage
  out_to_console = false,
  out_to_ncurses = false,
  out_to_stderr = false,
  out_to_x = true,
  own_window = true,
  own_window_class = 'Conky',
  own_window_type = 'normal',
  own_window_transparent = false,
  -- set transparency:
  own_window_argb_visual = true, own_window_argb_value = 192,
  show_graph_range = false,
  show_graph_scale = false,
  stippled_borders = 0,
  update_interval = 2.0,
  uppercase = false,
  use_spacer = 'none',
  use_xft = true,
  lua_load = '~/.config/conky/MyFunctions.lua',
  lua_draw_hook_post = "main",
}
conky.text = [[
${color}Info:${color1} ${scroll 32 $nodename $kernel}${alignr}${color} Uptime:${color1} $uptime
${color}Battery:${color1} $battery_percent%${color}${if_match ${execpi 3600 checkupdates | wc -l} > 1}${color}Updates:${color2} ${execpi 3600 checkupdates | wc -l}${color} ready to install!${endif}
$${hr}
${color}RAM Used / Buffers / Max:${alignr}Swap Used / Max:
${color1}${mem} / ${buffers} / ${memmax}${alignr}${swap} / ${swapmax}
${color}CPU %:${color1} $cpu% ${cpubar cpu0 5,125}${alignr}${color}CPU Frequency:${color1} $freq${color} MHz
${color}Processes:${color1} $processes       ${color}Load:${color1} $loadavg
${color}Name                 CPU%   MEM%   PID
${color1} ${top name 1} ${color4} ${top cpu 1} ${top mem 1} ${top pid 1}
${color1} ${top name 2} ${color4} ${top cpu 2} ${top mem 2} ${top pid 2}
${color1} ${top name 3} ${color4} ${top cpu 3} ${top mem 3} ${top pid 3}
${color}$hr
${color}File systems: Used / Free / Max / IO
${color} /       ${color1}${fs_used /} / ${fs_free /} / ${fs_size /} / ${diskio /dev/sda}
${fs_bar 5 /}
${color} home    ${color1}${fs_used /home} / ${fs_free /home} / ${fs_size /home} /  ${diskio /dev/sdb}
${fs_bar 5 /home}
${color} Data    ${color1}${fs_used /media/Data} / ${fs_free /media/Data} / ${fs_size /media/Data} / ${diskio /dev/sdc}
${fs_bar 5 /media/Data}\
# Don't show NAS if not mounted
${if_existing /media/NAS/bck/}
${color} NAS     ${color1}${fs_used /media/NAS} / ${fs_free /media/NAS} / ${fs_size /media/NAS}
${fs_bar 5 /media/NAS}${endif}\
# Don't show hdd1 if not mounted
${if_existing /media/hdd1/Chapters.txt}
${color} Videos  ${color1}${fs_used /media/hdd1} / ${fs_free /media/hdd} / ${fs_size /media/hdd1}
${fs_bar 5 /media/hdd1}${endif}
${color}$hr
# Networking section will not show anything if no NICS are up
# Will show speed and graph per NIC if they are up
${if_existing /sys/class/net/enp3s0/operstate up}${color}Ethernet
${color}Down: ${color1}${downspeed enp3s0}s ${alignr}${color}Up: ${color1}${upspeed enp3s0}/s
${downspeedgraph enp3s0 50,200 dca3a3 ffffff -l -t} ${alignr}${color1}${upspeedgraph enp3s0 50,200 dca3a3 ffffff -l -t}
${color}Total: ${color1}${totaldown enp3s0} ${alignr}${color}Total: ${color1}${totalup enp3s0}
${endif}${if_existing /sys/class/net/wlp2s0/operstate up}${color}WiFi
${color}Down: ${color1}${downspeed wlp2s0}/s ${alignr}${color}${color}Up: ${color1}${upspeed wlp2s0}/s
${downspeedgraph wlp2s0 50,200 dddddd ffffff -l -t} ${alignr}${color1}${upspeedgraph wlp2s0 50,200 dddddd ffffff -l -t}
${color}Total: ${color1}${totaldown wlp2s0} ${alignr}${color}Total: ${color1}${totalup wlp2s0}${endif}
${color}$hr
${color}Temperature:
${color} ISA     ${color1}${exec sensors | awk ' /Package/ {print $4}'}${alignr}${alignr}${color}CPU     ${color1}${exec sensors | grep 'Core 0' | awk '{print $3}'}
${color} ACPI    ${color1}${exec sensors | grep --after-context=2 'acpitz' | awk 'FNR ==3 {print $2}'}${alignr}${color}WiFi    ${color1}${exec sensors | grep --after-context=2 'ath10k' | awk 'FNR ==3 {print $2}'}
${color} GPU     ${color1}+${exec nvidia-settings --query=gpucoretemp 2>/dev/null | grep 'GPUCoreTemp' | grep "\[gpu:0\]" | awk '{print $4}'}0°C
${color} SSD     ${color1}+${hddtemp /dev/sda}.0°C${alignr}${color}HDD     ${color1}+${hddtemp /dev/sdc}.0°C
${color2}${execgraph "sensors | grep 'Core 0' | awk '{print $3}' | cut -b2,3"}
]]
Note: Needs extra/pacman-contrib with option 1 installed to show updates.
