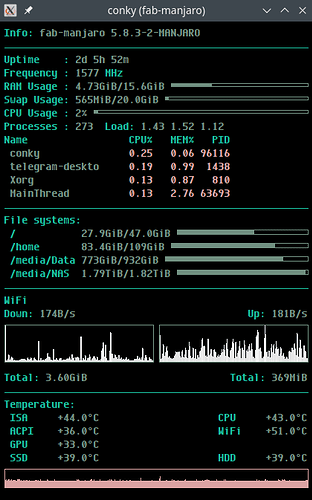
You’re ready to start using Conky.
Don’t be like me and skip straight to the settings but read the installation, configuration, … sections in their natural order.
Also if you want graphical “dials”, “progress bars”, and other eye candy, don’t pamac install conky, but pamac install conky-cairo instead.
(that took me a while to figure out)
Also, create your own conky.config from scratch as your system is different from any other system and using my config:
conky.config =
{
  console_bar_fill   = '»',
  console_bar_unfill = ' ',

  alignment = 'top_left',
  background = false,
  border_width = 2,
  cpu_avg_samples = 2,
  -- define Manjaro colours:
  default_color = '#1abc9c',  -- Same HTML as current terminal
  color1 = '#709080',         -- Kakhi
  color2 = '#dca3a3',         -- Salmon
  color3 = '#72d5a3',         -- Light Green
  color4 = '#f0dfaf',         -- Yellow
  color5 = '#7eb2e6',         -- Metal blue
  color6 = '#a45ec1',         -- Light aubergine
  font   = 'Envy Code R:bold:size=8',
  default_outline_color = '#1abc9c',  -- Same HTML as current terminal
  default_shade_color = '#1abc9c',  -- Same HTML as current terminal
  double_buffer = true,
  draw_borders = false,
  draw_graph_borders = true,
  draw_outline = false,
  draw_shades = false,
  extra_newline = false,
  format_human_readable=true,
  gap_x = 25,
  gap_y = 25,
  minimum_height = 200,
  minimum_width = 200,
  net_avg_samples = 2,
  no_buffers = true,
  out_to_console = false,
  out_to_ncurses = false,
  out_to_stderr = false,
  out_to_x = true,
  own_window = true,
  own_window_class = 'Conky',
  own_window_type = 'normal',
  own_window_transparent = false,
  -- set transparency:
  own_window_argb_visual = true, own_window_argb_value = 100,
  show_graph_range = false,
  show_graph_scale = false,
  stippled_borders = 0,
  update_interval = 2.0,
  uppercase = false,
  use_spacer = 'none',
  use_xft = true,
  lua_load = '~/.config/conky/MyFunctions.lua',
  lua_draw_hook_post = "main",
}
conky.text = [[
${color}Info:${color1} ${scroll 32 $nodename $kernel}
${color}$hr
${color}Uptime    :${color1} $uptime
${color}Frequency :${color1} $freq ${color}MHz
#${color}RAM Usage :${color1} ${lua conky_RoundUp ${mem} }/${lua conky_RoundUp ${memmax} } ${membar 4}
${color}RAM Usage :${color1} ${mem}/${memmax} ${membar 4}
#${color}Swap Usage:${color1} ${lua conky_RoundUp ${swap} }/${lua conky_RoundUp ${swapmax} } ${swapbar 4}
${color}Swap Usage:${color1} ${swap}/${swapmax} ${swapbar 4}
${color}CPU Usage :${color1} $cpu% ${cpubar 4}
${color}Processes :${color1} $processes  ${color}Load:${color1} $loadavg
${color}Name                 CPU%   MEM%   PID
${color1} ${top name 1} ${color2} ${top cpu 1} ${top mem 1} ${top pid 1}
${color1} ${top name 2} ${color2} ${top cpu 2} ${top mem 2} ${top pid 2}
${color1} ${top name 3} ${color2} ${top cpu 3} ${top mem 3} ${top pid 3}
${color1} ${top name 4} ${color2} ${top cpu 4} ${top mem 4} ${top pid 4}
${color}$hr
${color}File systems:
${color} /           ${color1}${fs_used /}/${fs_size /} ${fs_bar 6 /}
${color} /home       ${color1}${fs_used /home}/${fs_size /home} ${fs_bar 6 /home}
${color} /media/Data ${color1}${fs_used /media/Data}/${fs_size /media/Data} ${fs_bar 6 /media/Data}\
# Don't show NAS if not mounted
${if_existing /media/NAS/home/}
${color} /media/NAS  ${color1}${fs_used /media/NAS}/${fs_size /media/NAS} ${fs_bar 6 /media/NAS}${endif}
${color}$hr
# Networking section will not show anything if no NICS are up
# Will show speed and graph per NIC if they are up
${if_existing /sys/class/net/enp3s0/operstate up}${color}Ethernet
${color}Down: ${color1}${downspeed enp3s0}s ${alignr}${color}Up: ${color1}${upspeed enp3s0}/s
${downspeedgraph enp3s0 50,200 dca3a3 ffffff -l -t} ${alignr}${color1}${upspeedgraph enp3s0 50,200 dca3a3 ffffff -l -t}
${color}Total: ${color1}${totaldown enp3s0} ${alignr}${color}Total: ${color1}${totalup enp3s0}
${endif}${if_existing /sys/class/net/wlp2s0/operstate up}${color}WiFi
${color}Down: ${color1}${downspeed wlp2s0}/s ${alignr}${color}${color}Up: ${color1}${upspeed wlp2s0}/s
${downspeedgraph wlp2s0 50,200 dddddd ffffff -l -t} ${alignr}${color1}${upspeedgraph wlp2s0 50,200 dddddd ffffff -l -t}
${color}Total: ${color1}${totaldown wlp2s0} ${alignr}${color}Total: ${color1}${totalup wlp2s0}${endif}
${color}$hr
${color}Temperature:
${color} ISA     ${color1}${exec sensors | awk ' /Package/ {print $4}'}${alignr}${alignr}${color}CPU     ${color1}${exec sensors | grep 'Core 0' | awk '{print $3}'}
${color} ACPI    ${color1}${exec sensors | grep --after-context=2 'acpitz' | awk 'FNR ==3 {print $2}'}${alignr}${color}WiFi    ${color1}${exec sensors | grep --after-context=2 'ath10k' | awk 'FNR ==3 {print $2}'}
${color} GPU     ${color1}+${exec nvidia-settings --query=gpucoretemp 2>/dev/null | grep 'GPUCoreTemp' | grep "\[gpu:0\]" | awk '{print $4}'}0°C
${color} SSD     ${color1}+${hddtemp /dev/sda}.0°C${alignr}${color}HDD     ${color1}+${hddtemp /dev/sdc}.0°C
${color2}${execgraph "sensors | grep 'Core 0' | awk '{print $3}' | cut -b2,3"}
]]
Will very probably not give you something like this:
Because:
- your Ethernet and WiFi ports are probably not called
enp3s0 and wlp2s0,
- you won’t necessarily have
hddtemp installed
- have the
/media/Data mountpoint.
- etc.
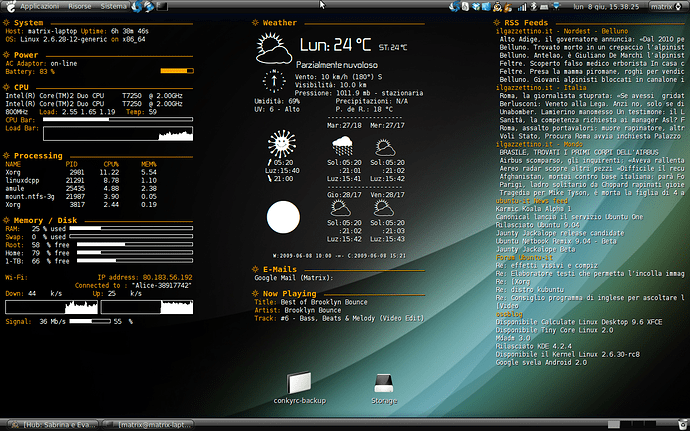
But Conky is extremely customizable and can even do stuff like this:
(Not a screenshot of my system: I’m not smart enough to do the above (yet) 


 Melissa


