RAM usage grows significantly after waking up PC from sleep

Hello,

Info:

  • System: Manjaro KDE
  • KDE version: 5.21.4
  • CPU: i5-4460
  • RAM: 16 GB
  • Swap: 16 GB
  • Kernel version: 5.11.14-1-MANJARO

Problem:

After some time the RAM usage (cache) is very high. I read somewhere that this might be the Kernel caching disk I/O or other Application’s caches but if that’s the case, shouldn’t it be freed if it’s needed?
I also ran this command: sudo lsof -s | sort -rnk 7 | numfmt --field=7 --to=iec | less but nothing obvious showed up. Htop doesn’t show anything interesting. Also, none of the tmpfs listed in df -h is filled up.

Example:

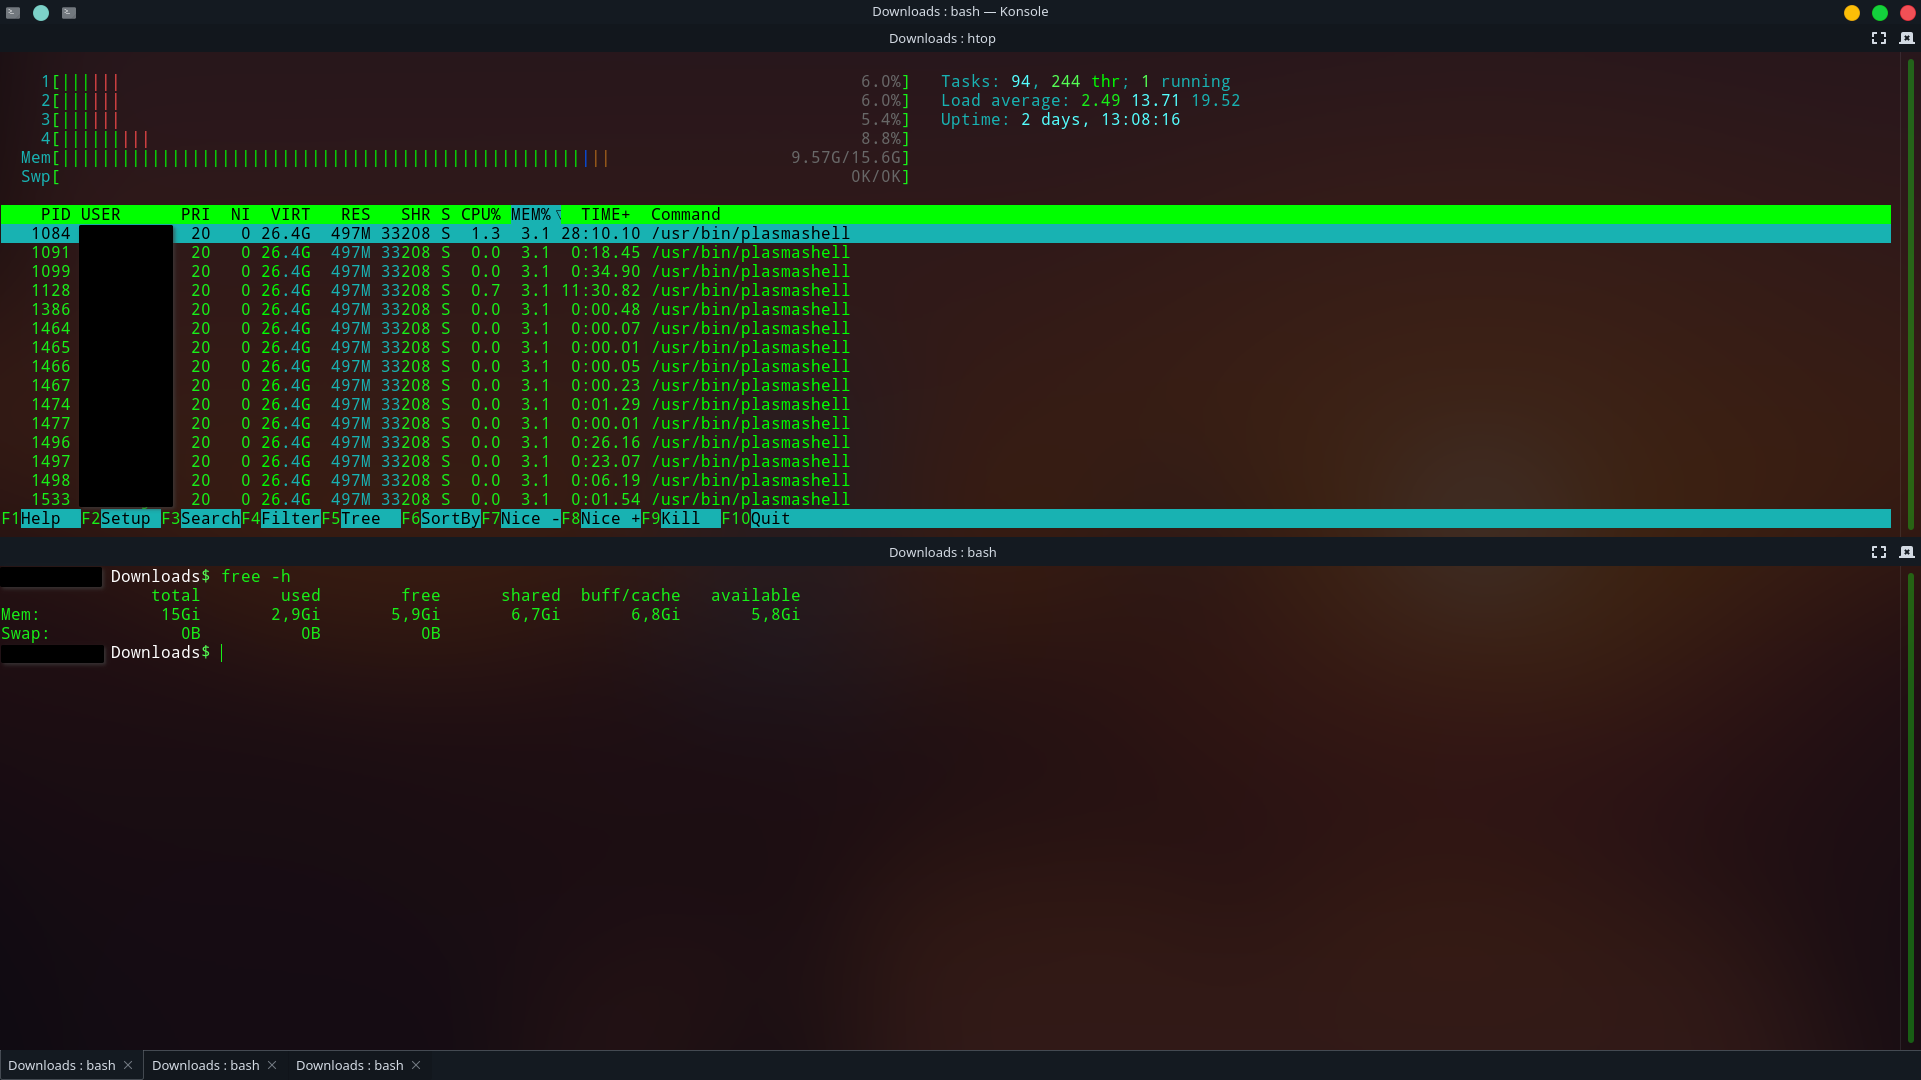
I closed every app except terminal, disabled the swap, dropped the caches (sync; echo 3 > /proc/sys/vm/drop_caches), ran the memory allocation program (from Experiments and fun with the Linux disk cache) which was killed at 5800MB and took this screenshot.


Now i opened by browser back to write this post, and the cache usage is even higher:

$ free -h
               total        used        free      shared  buff/cache   available
Mem:            15Gi       4,7Gi       560Mi       6,9Gi        10Gi       3,6Gi
Swap:           15Gi        30Mi        15Gi

Another example:

I have browser, file manager and couple of terminal emulators opened and htop shows 10GB (for some reason) used. Then I open a VM (with 4 GB ram) and the system becomes unresponsive because the ram is ~98% full. When I close the VM, the cache usage stays where it was before I ran the VM. Shouldn’t the cache be freed when it’s needed?? My PC should handle this workflow pretty easily but it doesn’t.

Thanks for any help.

Your RAM is fine.

https://www.linuxatemyram.com/

1 Like

If that’s the case, why doesn’t the cache get freed when it’s needed?

maybe 'cause your used and shared are high ?

I think the issue happens when I wake my PC from sleep. I don’t know how to delete this post, but I created another one explaining the issue


Moderator Edit: Posts merged

Hello everyone

Info:

  • System: Manjaro KDE
  • KDE version: 5.21.4
  • CPU: i5-4460
  • RAM: 16 GB
  • Swap: 16 GB
  • Kernel version: 5.11.14-1-MANJARO

Example

Before sleeping

$ free -h
               total        used        free      shared  buff/cache   available
Mem:            15Gi       4,7Gi       9,6Gi       326Mi       1,3Gi        10Gi
Swap:           15Gi          0B        15Gi

After sleep

$ free -h
               total        used        free      shared  buff/cache   available
Mem:            15Gi       5,2Gi       5,9Gi       3,4Gi       4,4Gi       6,7Gi
Swap:           15Gi          0B        15Gi

The most suspicious for me is the shared memory usage as it stays at max ~500MB during normal usage.

Trying to clear chaches

$ sudo bash -c 'sync; echo 3 > /proc/sys/vm/drop_caches'
[sudo] password for : 
$ free -h
               total        used        free      shared  buff/cache   available
Mem:            15Gi       5,2Gi       6,3Gi       3,4Gi       4,1Gi       6,6Gi
Swap:           15Gi          0B        15Gi

Trying to use program that just allocates memory from (linuxatemyram) Experiments and fun with the Linux disk cache

$ sudo swapoff -a 
$ free -h
               total        used        free      shared  buff/cache   available
Mem:            15Gi       5,7Gi       5,2Gi       3,3Gi       4,7Gi       6,3Gi
Swap:             0B          0B          0B
$ ./munch 
Allocated 1 MB
Allocated 2 MB
Allocated 3 MB
...
Allocated 6556 MB
Killed
$ free -h
               total        used        free      shared  buff/cache   available
Mem:            15Gi       5,6Gi       6,4Gi       3,3Gi       3,5Gi       6,4Gi
Swap:             0B          0B          0B

The buff/cache dropped by about 1GB but shared memory didn’t change.


I’m pretty sure that isn’t normal as this affects my ability to run memory hungry apps after some time. (The system freezes if I do so)

I appreciate any help :slight_smile:

1 Like

You could check ipcs --human and du -sh /dev/shm/.

Thank you for responding!

ipcs --human:

------ Message Queues --------
key        msqid      owner      perms      size         messages    

------ Shared Memory Segments --------
key        shmid      owner      perms      size       nattch     status      
0x00000000 688145     my_user    606         11,9M     2          dest         
0x51310022 18         my_user    600            8B     1                       
0x00000000 688147     my_user    606         11,9M     2          dest         
0x51310025 22         my_user    600         32,3K     1                       
0x00000000 720920     my_user    606            6M     2          dest         
0x00000000 720921     my_user    606            6M     2          dest         
0x00000000 622632     my_user    606         11,9M     2          dest         
0x00000000 622633     my_user    606         11,9M     2          dest         
0x00000000 622652     my_user    606            6M     2          dest         
0x00000000 622653     my_user    606            6M     2          dest         

------ Semaphore Arrays --------
key        semid      owner      perms      nsems     
0x5131001e 0          my_user    600        1         
0x51310021 3          my_user    600        1         
0x51310024 5          my_user    600        1         
0x002fa327 6          root       600        2

du -sh /dev/shm/:

24K     /dev/shm/

Nothing obvious.

One observation: When I close every app and make my PC go to sleep, after waking it up, the (free -h) used grows by about 2GB. If I don’t close every app, not only used grows but also shared and buff/cache. Every time RAM usage (used or shared or buff) grows after sleep, it doesn’t get significantly freed by any of the methods I described before.

Ok, at this point I have no Idea what causes what. Once only used column is growing, and other times the used+shared+buff/cache is growing. I’m sure there is a issue somewhere because I have the same setup (Manjaro+KDE+Most of the apps) on my laptop and procedure like this: open a bunch of apps, close them, clear caches, brings the memory usage very close to fresh boot, and sleeping doesn’t affects memory usage.

The title doesn’t fully describe the issue, but after merging the posts I can not change it. Can any moderator (maybe @Yochanan?) change the title to something like: RAM usage grows significantly after waking up PC from sleep. (this additional RAM is not easily reclaimable)

Your request has been processed.

1 Like

I have similar problem. It is reproducing in different distributive, like Manjaro and NixOs. I have different environment gnome 3, mate and sway and different hardware - amd. Do have you installed lxd? Isn’t enough to send number to drop_caches or close program for my situation. You need to first close program and second send to drop_caches. Maybe echo 2 > /proc/sys/vm/drop_caches be enough. I don’t find patterns for this case but I close only Firefox and it allow to free almost all leaked ram. I see that in case that you run program from linuxatemyram you have disabled swap. If I try to allocate free memory, then It move it to swap(I use zram, but it may cause significant slowing if swap located in slow storage like hdd). After closing program I got something like that.

free -hw
              total        used        free      shared     buffers       cache   available
Mem:           13Gi       7,7Gi       3,7Gi       575Mi       0,0Ki       2,2Gi       5,2Gi
Swap:          10Gi       3,0Gi       7,3Gi

I have different root filesystem ext4 and btrfs.

Can you describe it characteristics? Maybe it has less ram? Or maybe it haven’t virtual machine or containers?

Welcome on the forum and thanks for replying!

No I don’t.

That’s exactly what I did when I was taking those screenshots.

Yes indeed, my laptop has less ram - 8GB - but that shouldn’t affect the ram management, right? Also, I didn’t had any virtual machines nor containers running when I was taking the screenshots/describing the issue.

Also: sorry if i misunderstood some of your post.

I haven’t any times when memory usage exceeds half of all memory, so it may be reason of this. It can be easy checked: see current usage with all closed programs and usage after reboot. I see absence of leak in some cases, but I doesn’t noticed yet condition, because I try to change some buffer size and values like vfs_cache_pressure.

Update: Until I get this fixed, my workaround is to not use sleep but setup swapfile and just hibernate my system instead. It’s a bit slower to boot but it doesn’t have this weird RAM issue.

I wrote simple script to analyze which component is leaking. If you have any suggestions, I be grateful.

First of all, you need save memory usage before sleep. This command require root privileges, maybe you prefer use sudo. We save usage to file. Be sure, that file “1” doesn’t exist, otherwise it be rewritten.

cat /proc/slabinfo > 1

After that we going to sleep, and after sleep also save usage to another file and we using this script on ruby.

#!/usr/bin/env ruby

def read_f name
  File.read(name).gsub!(/ +/, ' ').split("\n").map { |i| i.split ' ' }[2..-1]
end

before = read_f ARGV[0]
after = read_f ARGV[1]
before.map.with_index do |v, i|
  puts v.join("\t"), after[i].join("\t"), "---" if v[2].to_i * v[3].to_i < after[i][2].to_i *  after[i][3].to_i
end

Now I went to sleep two times and got this result. There is same category on both times, so I think that this item is reason of leak. Now I need more proof, that my suggestions are correct. I continue watching, but I need help in other cases on other machine.

# ./1.rb 1 2
nf_conntrack	475	475	320	25	2	:	tunables	0	0	0	:	slabdata	19	19	0
nf_conntrack	500	500	320	25	2	:	tunables	0	0	0	:	slabdata	20	20	0
---
TCPv6	91	91	2432	13	8	:	tunables	0	0	0	:	slabdata	7	7	0
TCPv6	104	104	2432	13	8	:	tunables	0	0	0	:	slabdata	8	8	0
---
dmaengine-unmap-16	4192	5544	192	21	1	:	tunables	0	0	0	:	slabdata	264	264	0
dmaengine-unmap-16	3941	5775	192	21	1	:	tunables	0	0	0	:	slabdata	275	275	0
---
proc_dir_entry	1827	1827	192	21	1	:	tunables	0	0	0	:	slabdata	87	87	0
proc_dir_entry	1974	1974	192	21	1	:	tunables	0	0	0	:	slabdata	94	94	0
---
proc_inode_cache	855	1392	672	24	4	:	tunables	0	0	0	:	slabdata	58	58	0
proc_inode_cache	2223	2952	672	24	4	:	tunables	0	0	0	:	slabdata	123	123	0
---
# ./1.rb 3 4
proc_inode_cache	1271	1632	672	24	4	:	tunables	0	0	0	:	slabdata	68	68	0
proc_inode_cache	992	1896	672	24	4	:	tunables	0	0	0	:	slabdata	79	79	0
---
Acpi-Parse	2198	2263	56	73	1	:	tunables	0	0	0	:	slabdata	31	31	0
Acpi-Parse	2336	2336	56	73	1	:	tunables	0	0	0	:	slabdata	32	32	0
---
radix_tree_node	53741	53844	584	28	4	:	tunables	0	0	0	:	slabdata	1923	1923	0
radix_tree_node	52869	54684	584	28	4	:	tunables	0	0	0	:	slabdata	1953	1953	0
---
#

I ran your script and this is the result I got:

nf_conntrack    150     150     320     25      2       :       tunables        0       0       0       :       slabdata        6       6       0
nf_conntrack    200     200     320     25      2       :       tunables        0       0       0       :       slabdata        8       8       0
---
ext4_inode_cache        43389   43389   1192    27      8       :       tunables        0       0       0       :       slabdata        1607    1607    0
ext4_inode_cache        43551   43551   1192    27      8       :       tunables        0       0       0       :       slabdata        1613    1613    0
---
skbuff_ext_cache        18920   18963   192     21      1       :       tunables        0       0       0       :       slabdata        903     903     0
skbuff_ext_cache        21293   27006   192     21      1       :       tunables        0       0       0       :       slabdata        1286    1286    0
---
file_lock_cache 126     126     216     18      1       :       tunables        0       0       0       :       slabdata        7       7       0
file_lock_cache 144     144     216     18      1       :       tunables        0       0       0       :       slabdata        8       8       0
---
fsnotify_mark_connector 1792    1792    32      128     1       :       tunables        0       0       0       :       slabdata        14      14      0
fsnotify_mark_connector 4736    4736    32      128     1       :       tunables        0       0       0       :       slabdata        37      37      0
---
task_delay_info 1581    1581    80      51      1       :       tunables        0       0       0       :       slabdata        31      31      0
task_delay_info 1314    1632    80      51      1       :       tunables        0       0       0       :       slabdata        32      32      0
---
proc_inode_cache        3112    3381    688     23      4       :       tunables        0       0       0       :       slabdata        147     147     0
proc_inode_cache        7326    7452    688     23      4       :       tunables        0       0       0       :       slabdata        324     324     0
---
seq_file        136     136     120     34      1       :       tunables        0       0       0       :       slabdata        4       4       0
seq_file        170     170     120     34      1       :       tunables        0       0       0       :       slabdata        5       5       0
---
kernfs_node_cache       55889   56032   128     32      1       :       tunables        0       0       0       :       slabdata        1751    1751    0
kernfs_node_cache       58847   63520   128     32      1       :       tunables        0       0       0       :       slabdata        1985    1985    0
---
filp    11830   12992   256     16      1       :       tunables        0       0       0       :       slabdata        812     812     0
filp    11919   13056   256     16      1       :       tunables        0       0       0       :       slabdata        816     816     0
---
dentry  122848  122892  192     21      1       :       tunables        0       0       0       :       slabdata        5852    5852    0
dentry  128698  129129  192     21      1       :       tunables        0       0       0       :       slabdata        6149    6149    0
---
vm_area_struct  117440  123200  200     20      1       :       tunables        0       0       0       :       slabdata        6160    6160    0
vm_area_struct  117652  123320  200     20      1       :       tunables        0       0       0       :       slabdata        6166    6166    0
---
signal_cache    392     392     1152    28      8       :       tunables        0       0       0       :       slabdata        14      14      0
signal_cache    420     420     1152    28      8       :       tunables        0       0       0       :       slabdata        15      15      0
---
sighand_cache   305     330     2112    15      8       :       tunables        0       0       0       :       slabdata        22      22      0
sighand_cache   360     360     2112    15      8       :       tunables        0       0       0       :       slabdata        24      24      0
---
task_struct     776     804     8000    4       8       :       tunables        0       0       0       :       slabdata        201     201     0
task_struct     852     880     8000    4       8       :       tunables        0       0       0       :       slabdata        220     220     0
---
cred_jar        735     735     192     21      1       :       tunables        0       0       0       :       slabdata        35      35      0
cred_jar        1076    1218    192     21      1       :       tunables        0       0       0       :       slabdata        58      58      0
---
task_group      140     140     576     28      4       :       tunables        0       0       0       :       slabdata        5       5       0
task_group      168     168     576     28      4       :       tunables        0       0       0       :       slabdata        6       6       0
---
vmap_area       8704    8704    64      64      1       :       tunables        0       0       0       :       slabdata        136     136     0
vmap_area       8791    8832    64      64      1       :       tunables        0       0       0       :       slabdata        138     138     0
---
kmalloc-8k      95      112     8192    4       8       :       tunables        0       0       0       :       slabdata        28      28      0
kmalloc-8k      152     152     8192    4       8       :       tunables        0       0       0       :       slabdata        38      38      0
---
kmalloc-4k      1200    1216    4096    8       8       :       tunables        0       0       0       :       slabdata        152     152     0
kmalloc-4k      1219    1224    4096    8       8       :       tunables        0       0       0       :       slabdata        153     153     0
---
kmalloc-2k      742     784     2048    16      8       :       tunables        0       0       0       :       slabdata        49      49      0
kmalloc-2k      881     896     2048    16      8       :       tunables        0       0       0       :       slabdata        56      56      0
---
kmalloc-1k      14181   14208   1024    16      4       :       tunables        0       0       0       :       slabdata        888     888     0
kmalloc-1k      14533   15776   1024    16      4       :       tunables        0       0       0       :       slabdata        986     986     0
---
kmalloc-512     9694    9744    512     16      2       :       tunables        0       0       0       :       slabdata        609     609     0
kmalloc-512     9702    9808    512     16      2       :       tunables        0       0       0       :       slabdata        613     613     0
---
kmalloc-256     14128   14128   256     16      1       :       tunables        0       0       0       :       slabdata        883     883     0
kmalloc-256     23321   23536   256     16      1       :       tunables        0       0       0       :       slabdata        1471    1471    0
---
kmalloc-192     25410   25410   192     21      1       :       tunables        0       0       0       :       slabdata        1210    1210    0
kmalloc-192     16681   25473   192     21      1       :       tunables        0       0       0       :       slabdata        1213    1213    0
---
kmalloc-128     13504   13504   128     32      1       :       tunables        0       0       0       :       slabdata        422     422     0
kmalloc-128     14400   14400   128     32      1       :       tunables        0       0       0       :       slabdata        450     450     0
---
kmalloc-96      12474   12474   96      42      1       :       tunables        0       0       0       :       slabdata        297     297     0
kmalloc-96      23504   23940   96      42      1       :       tunables        0       0       0       :       slabdata        570     570     0
---
kmalloc-64      29371   29760   64      64      1       :       tunables        0       0       0       :       slabdata        465     465     0
kmalloc-64      30164   30720   64      64      1       :       tunables        0       0       0       :       slabdata        480     480     0
---
kmalloc-32      16123   16384   32      128     1       :       tunables        0       0       0       :       slabdata        128     128     0
kmalloc-32      16498   16896   32      128     1       :       tunables        0       0       0       :       slabdata        132     132     0
---

(Note: before sleep “used” ram: 3.3Gi, after: 5.3Gi)
I can run it once more it it would be helpful.

Yes, it is, now we need to found which parts become bigger and is any patterns in this.

Ok, I’ll do that when I come back home.